Estimated Value: $170,000 - $185,000
2
Beds
2
Baths
1,008
Sq Ft
$176/Sq Ft
Est. Value
About This Home
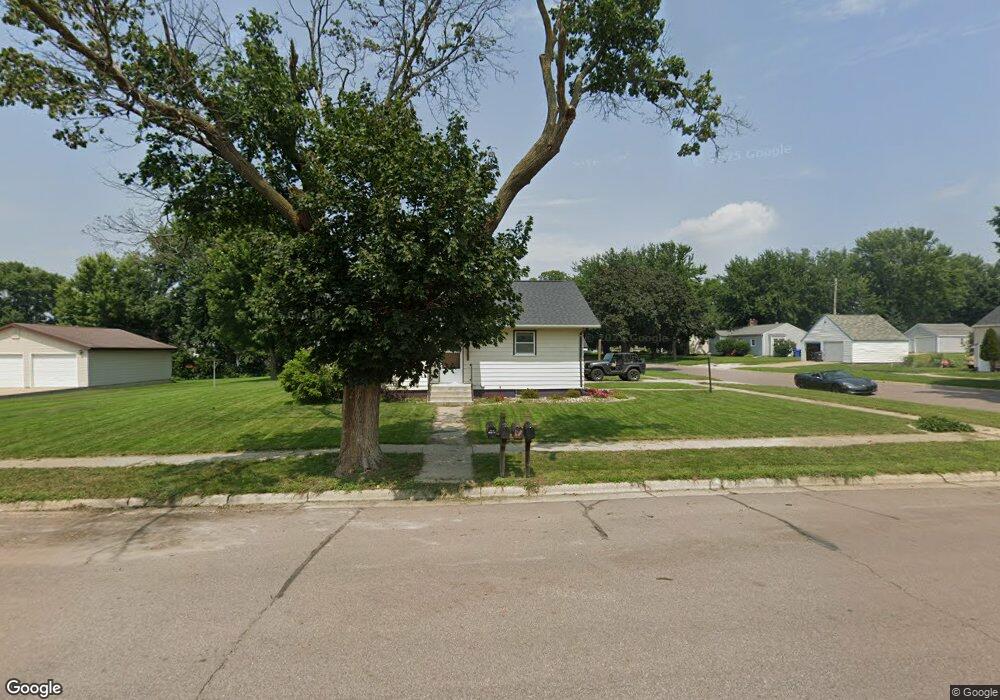
This home is located at 1119 3rd St, Hull, IA 51239 and is currently estimated at $177,496, approximately $176 per square foot. 1119 3rd St is a home located in Sioux County with nearby schools including Boyden-Hull Elementary School, Boyden-Hull High School, and Hull Christian School.
Ownership History
Date
Name
Owned For
Owner Type
Purchase Details
Closed on
Mar 13, 2018
Sold by
Katsw Lavonne J
Bought by
Kats Gart J
Current Estimated Value
Home Financials for this Owner
Home Financials are based on the most recent Mortgage that was taken out on this home.
Original Mortgage
$75,000
Interest Rate
3.94%
Mortgage Type
New Conventional
Purchase Details
Closed on
Jan 16, 2018
Sold by
Kooiker Nick W and Kooiker Janet
Bought by
Kats Gary J
Home Financials for this Owner
Home Financials are based on the most recent Mortgage that was taken out on this home.
Original Mortgage
$75,000
Interest Rate
3.94%
Mortgage Type
New Conventional
Create a Home Valuation Report for This Property
The Home Valuation Report is an in-depth analysis detailing your home's value as well as a comparison with similar homes in the area
Purchase History
| Date | Buyer | Sale Price | Title Company |
|---|---|---|---|
| Kats Gart J | -- | -- | |
| Kats Gary J | $105,000 | -- |
Source: Public Records
Mortgage History
| Date | Status | Borrower | Loan Amount |
|---|---|---|---|
| Previous Owner | Kats Gary J | $75,000 |
Source: Public Records
Tax History
| Year | Tax Paid | Tax Assessment Tax Assessment Total Assessment is a certain percentage of the fair market value that is determined by local assessors to be the total taxable value of land and additions on the property. | Land | Improvement |
|---|---|---|---|---|
| 2025 | $1,906 | $159,970 | $19,130 | $140,840 |
| 2024 | $1,906 | $135,730 | $19,130 | $116,600 |
| 2023 | $1,874 | $135,730 | $19,130 | $116,600 |
| 2022 | $1,844 | $116,110 | $19,130 | $96,980 |
| 2021 | $1,758 | $115,750 | $19,130 | $96,620 |
| 2020 | $1,758 | $105,400 | $19,130 | $86,270 |
| 2019 | $1,488 | $89,440 | $7,970 | $81,470 |
| 2018 | $1,680 | $89,440 | $7,970 | $81,470 |
| 2017 | $1,680 | $89,440 | $7,970 | $81,470 |
| 2014 | $1,400 | $75,370 | $0 | $0 |
Source: Public Records
Map
Nearby Homes
Your Personal Tour Guide
Ask me questions while you tour the home.