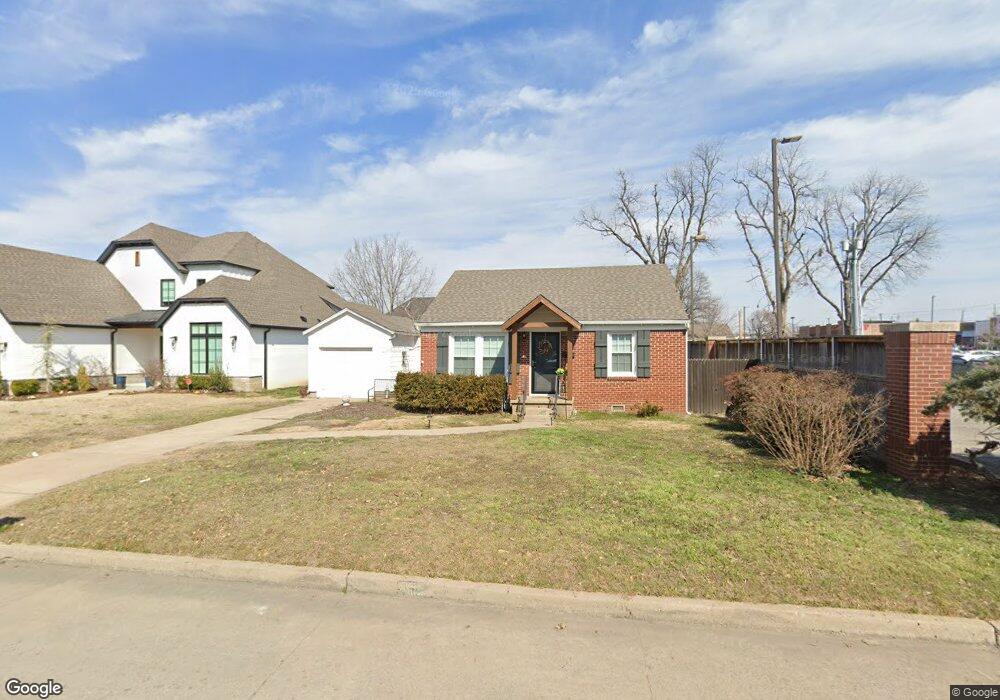
1119 E 38th St Tulsa, OK 74105
Brookside NeighborhoodEstimated Value: $226,613 - $288,000
2
Beds
1
Bath
928
Sq Ft
$272/Sq Ft
Est. Value
About This Home
This home is located at 1119 E 38th St, Tulsa, OK 74105 and is currently estimated at $252,653, approximately $272 per square foot. 1119 E 38th St is a home located in Tulsa County with nearby schools including Eliot Elementary School, Edison Preparatory School, and Thomas Edison Preparatory High School.
Ownership History
Date
Name
Owned For
Owner Type
Purchase Details
Closed on
Oct 21, 2014
Sold by
Cole Michael E and Cole Carey M
Bought by
Riverview Property Co Llc
Current Estimated Value
Purchase Details
Closed on
Jul 16, 2007
Sold by
Dixon Neal Stephen and Dixon Neal Jessica
Bought by
Cole Michael E and Cole Carey M
Home Financials for this Owner
Home Financials are based on the most recent Mortgage that was taken out on this home.
Original Mortgage
$85,000
Interest Rate
6.54%
Mortgage Type
Purchase Money Mortgage
Purchase Details
Closed on
Mar 25, 2004
Sold by
Black James David and Black Pamela K
Bought by
Neal Stephen
Home Financials for this Owner
Home Financials are based on the most recent Mortgage that was taken out on this home.
Original Mortgage
$88,374
Interest Rate
5.59%
Mortgage Type
Purchase Money Mortgage
Create a Home Valuation Report for This Property
The Home Valuation Report is an in-depth analysis detailing your home's value as well as a comparison with similar homes in the area
Home Values in the Area
Average Home Value in this Area
Purchase History
| Date | Buyer | Sale Price | Title Company |
|---|---|---|---|
| Riverview Property Co Llc | $125,000 | None Available | |
| Cole Michael E | $115,000 | First American Title & Abstr | |
| Neal Stephen | $86,000 | Firstitle & Abstract Service |
Source: Public Records
Mortgage History
| Date | Status | Borrower | Loan Amount |
|---|---|---|---|
| Previous Owner | Cole Michael E | $85,000 | |
| Previous Owner | Neal Stephen | $88,374 |
Source: Public Records
Tax History
| Year | Tax Paid | Tax Assessment Tax Assessment Total Assessment is a certain percentage of the fair market value that is determined by local assessors to be the total taxable value of land and additions on the property. | Land | Improvement |
|---|---|---|---|---|
| 2025 | $2,352 | $17,549 | $4,083 | $13,466 |
| 2024 | $2,020 | $16,713 | $4,481 | $12,232 |
| 2023 | $2,020 | $15,917 | $3,800 | $12,117 |
| 2022 | $2,021 | $15,159 | $5,288 | $9,871 |
| 2021 | $1,907 | $14,438 | $5,037 | $9,401 |
| 2020 | $1,791 | $13,750 | $4,797 | $8,953 |
| 2019 | $1,884 | $13,750 | $4,797 | $8,953 |
| 2018 | $1,888 | $13,750 | $4,797 | $8,953 |
| 2017 | $1,885 | $13,750 | $4,797 | $8,953 |
| 2016 | $1,846 | $13,750 | $4,441 | $9,309 |
| 2015 | $1,850 | $13,750 | $4,441 | $9,309 |
| 2014 | $1,736 | $13,029 | $4,441 | $8,588 |
Source: Public Records
Map
Nearby Homes
- 1009 E 38th St
- 1320 E 38th St Unit 1320
- 1324 E 38th St Unit 1324
- 3758 S Madison Ave Unit 5
- 3704 S Madison Ave Unit 3704
- 1340 E 38th St Unit D
- 3921 S Madison Ave
- 1004 E 36th St
- 1031 E 36th St
- 3767 Riverside Dr Unit 3767
- 3779 Riverside Dr Unit 3779
- 3777 Riverside Dr Unit 3777
- 3773 Riverside Dr Unit 3773
- 3769 Riverside Dr Unit 3769
- 1104 E 35th Place
- 3755 Riverside Dr Unit 3755
- 3947 S Madison Ave
- 3701 Riverside Dr Unit 14
- 3701 Riverside Dr Unit 6
- 3701 Riverside Dr Unit 12
- 1115 E 38th St
- 1111 E 38th St
- 1120 E 37th Place
- 1116 E 37th Place
- 1124 E 37th Place
- 1105 E 38th St
- 1112 E 37th Place
- 1124 E 38th St
- 1120 E 38th St
- 1114 E 38th St
- 1106 E 37th Place
- 1101 E 38th St
- 1110 E 38th St
- 1106 E 38th St
- 1123 E 38th Place
- 1119 E 37th Place
- 1115 E 38th Place
- 1131 E 37th Place
- 1115 E 37th Place
- 1127 E 37th Place
Your Personal Tour Guide
Ask me questions while you tour the home.