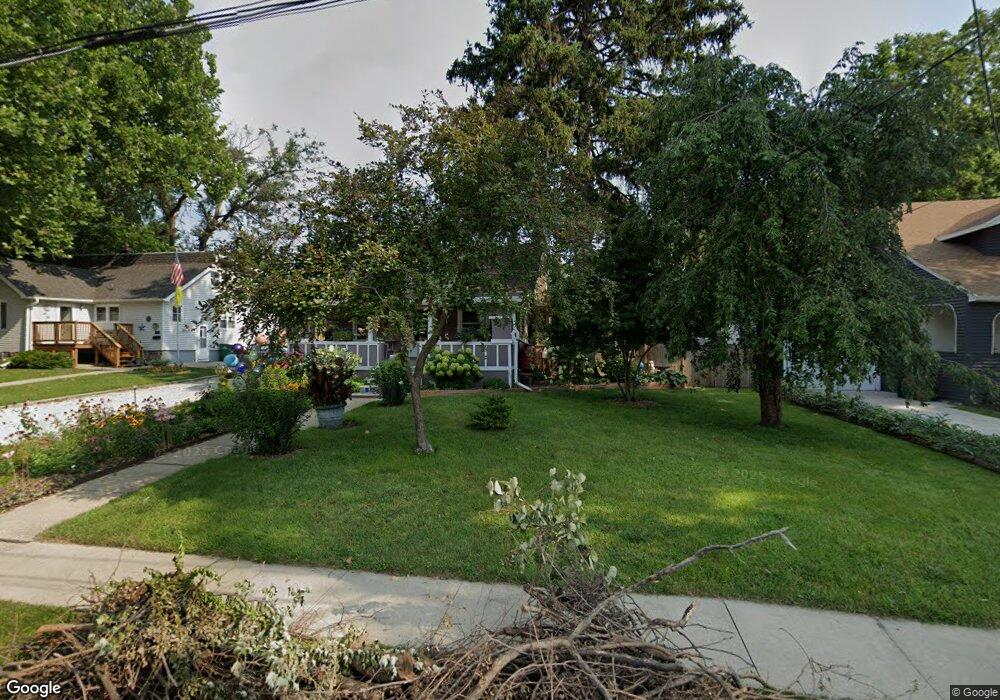
1119 Locust St West Des Moines, IA 50265
Estimated Value: $239,000 - $269,000
3
Beds
1
Bath
1,292
Sq Ft
$197/Sq Ft
Est. Value
About This Home
This home is located at 1119 Locust St, West Des Moines, IA 50265 and is currently estimated at $253,932, approximately $196 per square foot. 1119 Locust St is a home located in Polk County with nearby schools including Hillside Elementary School, Stilwell Junior High School, and Valley Southwoods Freshman High School.
Ownership History
Date
Name
Owned For
Owner Type
Purchase Details
Closed on
Apr 15, 2004
Sold by
Robinette Anthony P and Robinette Michele H
Bought by
Glenn Brian W and Riley Glenn Lori Julie
Current Estimated Value
Home Financials for this Owner
Home Financials are based on the most recent Mortgage that was taken out on this home.
Original Mortgage
$133,000
Outstanding Balance
$62,588
Interest Rate
5.66%
Mortgage Type
Purchase Money Mortgage
Estimated Equity
$191,344
Purchase Details
Closed on
Dec 24, 2002
Sold by
Lab Investment Co Inc
Bought by
Robinette Anthony P and Robinette Michele H
Home Financials for this Owner
Home Financials are based on the most recent Mortgage that was taken out on this home.
Original Mortgage
$114,600
Interest Rate
10%
Mortgage Type
Seller Take Back
Create a Home Valuation Report for This Property
The Home Valuation Report is an in-depth analysis detailing your home's value as well as a comparison with similar homes in the area
Home Values in the Area
Average Home Value in this Area
Purchase History
| Date | Buyer | Sale Price | Title Company |
|---|---|---|---|
| Glenn Brian W | $132,500 | -- | |
| Robinette Anthony P | $122,500 | -- | |
| Robinette Anthony P | $123,000 | -- |
Source: Public Records
Mortgage History
| Date | Status | Borrower | Loan Amount |
|---|---|---|---|
| Open | Glenn Brian W | $133,000 | |
| Previous Owner | Robinette Anthony P | $114,600 |
Source: Public Records
Tax History Compared to Growth
Tax History
| Year | Tax Paid | Tax Assessment Tax Assessment Total Assessment is a certain percentage of the fair market value that is determined by local assessors to be the total taxable value of land and additions on the property. | Land | Improvement |
|---|---|---|---|---|
| 2025 | $3,378 | $244,500 | $91,700 | $152,800 |
| 2024 | $3,378 | $223,600 | $83,400 | $140,200 |
| 2023 | $3,382 | $223,600 | $83,400 | $140,200 |
| 2022 | $3,340 | $184,000 | $72,000 | $112,000 |
| 2021 | $3,170 | $184,000 | $72,000 | $112,000 |
| 2020 | $3,118 | $166,700 | $65,500 | $101,200 |
| 2019 | $3,032 | $166,700 | $65,500 | $101,200 |
| 2018 | $3,034 | $156,500 | $60,300 | $96,200 |
| 2017 | $2,898 | $156,500 | $60,300 | $96,200 |
| 2016 | $2,830 | $145,600 | $55,300 | $90,300 |
| 2015 | $2,830 | $145,600 | $55,300 | $90,300 |
| 2014 | $2,672 | $140,700 | $52,400 | $88,300 |
Source: Public Records
Map
Nearby Homes