Estimated Value: $429,731 - $465,000
4
Beds
2
Baths
1,233
Sq Ft
$363/Sq Ft
Est. Value
About This Home
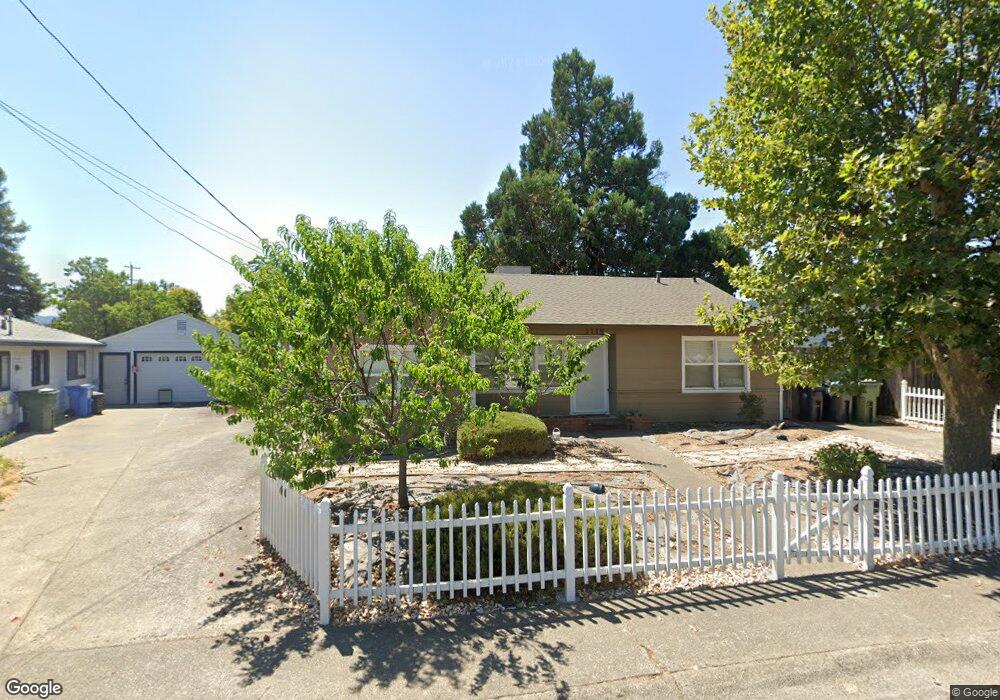
This home is located at 1119 N Oak St, Ukiah, CA 95482 and is currently estimated at $447,683, approximately $363 per square foot. 1119 N Oak St is a home located in Mendocino County with nearby schools including Frank Zeek Elementary School, Pomolita Middle School, and Ukiah High School.
Ownership History
Date
Name
Owned For
Owner Type
Purchase Details
Closed on
Apr 13, 2017
Sold by
Pearson Tyler J and Pearson Carli A Orsi
Bought by
Powis Erin
Current Estimated Value
Purchase Details
Closed on
Nov 16, 2012
Sold by
Federal Home Loan Mortgage Corporation
Bought by
Pearson Tyler J and Pearson Carli A Orsi
Home Financials for this Owner
Home Financials are based on the most recent Mortgage that was taken out on this home.
Original Mortgage
$201,400
Interest Rate
3.36%
Mortgage Type
New Conventional
Purchase Details
Closed on
Aug 16, 2012
Sold by
Bartlett Lawrence R and Bartlett Kay H
Bought by
Federal Home Loan Mortgage Corporation
Purchase Details
Closed on
Sep 7, 1999
Sold by
Salmen Walter H and Salmen Neelam
Bought by
Bartlett Lawrence R and Bartlett Kay H
Home Financials for this Owner
Home Financials are based on the most recent Mortgage that was taken out on this home.
Original Mortgage
$129,000
Interest Rate
7.66%
Mortgage Type
VA
Create a Home Valuation Report for This Property
The Home Valuation Report is an in-depth analysis detailing your home's value as well as a comparison with similar homes in the area
Home Values in the Area
Average Home Value in this Area
Purchase History
| Date | Buyer | Sale Price | Title Company |
|---|---|---|---|
| Powis Erin | $330,000 | Redwood Empire Title Co | |
| Pearson Tyler J | $212,000 | California Title Company | |
| Federal Home Loan Mortgage Corporation | $163,245 | Pacific Coast Title | |
| Bartlett Lawrence R | $126,500 | Redwood Empire Title Company |
Source: Public Records
Mortgage History
| Date | Status | Borrower | Loan Amount |
|---|---|---|---|
| Previous Owner | Pearson Tyler J | $201,400 | |
| Previous Owner | Bartlett Lawrence R | $129,000 |
Source: Public Records
Tax History Compared to Growth
Tax History
| Year | Tax Paid | Tax Assessment Tax Assessment Total Assessment is a certain percentage of the fair market value that is determined by local assessors to be the total taxable value of land and additions on the property. | Land | Improvement |
|---|---|---|---|---|
| 2025 | $4,574 | $382,987 | $116,056 | $266,931 |
| 2023 | $4,574 | $368,117 | $111,550 | $256,567 |
| 2022 | $4,382 | $360,900 | $109,363 | $251,537 |
| 2021 | $4,285 | $353,824 | $107,219 | $246,605 |
| 2020 | $4,223 | $350,196 | $106,120 | $244,076 |
| 2019 | $3,986 | $343,332 | $104,040 | $239,292 |
| 2018 | $3,888 | $336,600 | $102,000 | $234,600 |
| 2017 | $2,526 | $224,939 | $95,493 | $129,446 |
| 2016 | $2,449 | $220,529 | $93,621 | $126,908 |
| 2015 | $2,428 | $217,217 | $92,215 | $125,002 |
| 2014 | $2,371 | $212,963 | $90,409 | $122,554 |
Source: Public Records
Map
Nearby Homes