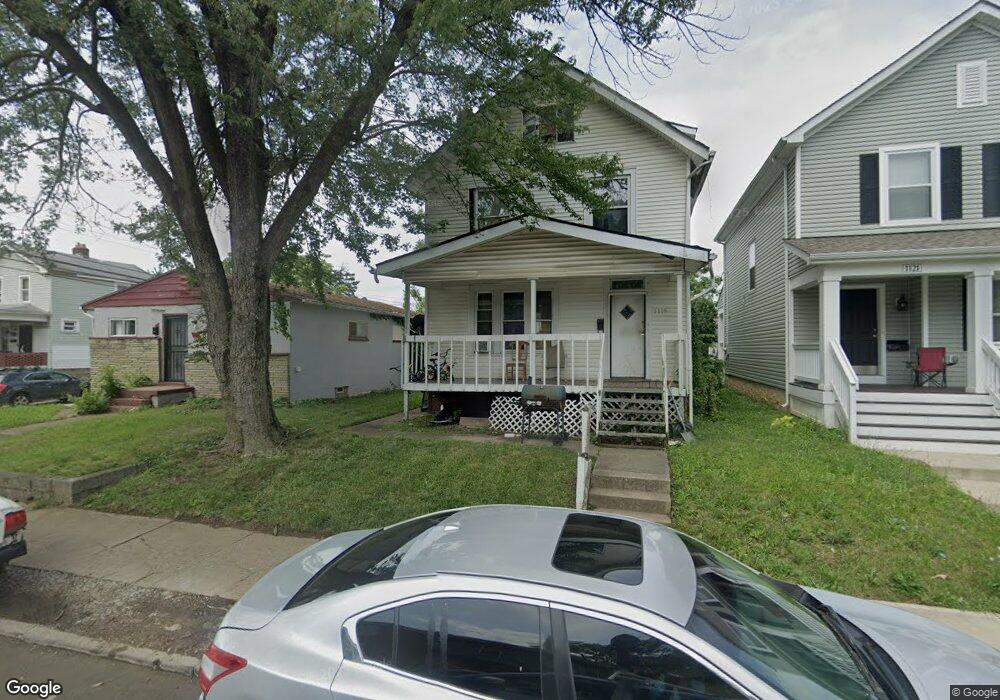
1119 Peters Ave Columbus, OH 43201
Milo-Grogan NeighborhoodEstimated Value: $106,000 - $186,000
4
Beds
1
Bath
1,291
Sq Ft
$118/Sq Ft
Est. Value
About This Home
This home is located at 1119 Peters Ave, Columbus, OH 43201 and is currently estimated at $152,598, approximately $118 per square foot. 1119 Peters Ave is a home located in Franklin County with nearby schools including Windsor Stem Acadmey, Linden-Mckinley Stem School On Arcadia, and Columbus Performance Academy.
Ownership History
Date
Name
Owned For
Owner Type
Purchase Details
Closed on
Sep 23, 2016
Sold by
R & R Properties Group Of Ohio Llc
Bought by
Heard Ashley
Current Estimated Value
Purchase Details
Closed on
Jun 10, 2009
Sold by
Moequity Llc
Bought by
Ties Group Of Ohio Llc
Purchase Details
Closed on
Dec 24, 2007
Sold by
Crews Jevon M and Aames Home Loan
Bought by
Accredited Home Lenders Inc
Purchase Details
Closed on
May 20, 2005
Sold by
Tanner Gregory L
Bought by
Crews Jevon M
Home Financials for this Owner
Home Financials are based on the most recent Mortgage that was taken out on this home.
Original Mortgage
$57,000
Interest Rate
9.36%
Mortgage Type
Fannie Mae Freddie Mac
Purchase Details
Closed on
Jun 24, 1998
Sold by
Kirkish Douglas J
Bought by
Kirkish Douglas J and Kirkish Mary J
Purchase Details
Closed on
Dec 7, 1990
Create a Home Valuation Report for This Property
The Home Valuation Report is an in-depth analysis detailing your home's value as well as a comparison with similar homes in the area
Home Values in the Area
Average Home Value in this Area
Purchase History
| Date | Buyer | Sale Price | Title Company |
|---|---|---|---|
| Heard Ashley | $16,500 | Independence Title Services | |
| Ties Group Of Ohio Llc | $37,300 | Attorney | |
| Accredited Home Lenders Inc | $48,000 | None Available | |
| Crews Jevon M | $76,500 | Land Sel Ti | |
| Tanner Gregory L | $36,000 | Land Sel Ti | |
| Kirkish Douglas J | -- | -- | |
| Kirkish Douglas J | $1,900 | -- | |
| Kirkish Douglas J | $1,900 | -- | |
| Kirkish Douglas J | $1,900 | -- | |
| Kirkish Douglas J | $1,000 | -- | |
| Kirkish Douglas J | $1,000 | -- | |
| Kirkish Douglas J | $1,000 | -- | |
| Kirkish Douglas J | $1,000 | -- | |
| Kirkish Douglas J | $1,000 | -- | |
| Kirkish Douglas J | $1,000 | -- | |
| Kirkish Douglas J | $1,000 | -- | |
| Kirkish Douglas J | $1,000 | -- | |
| -- | -- | -- |
Source: Public Records
Mortgage History
| Date | Status | Borrower | Loan Amount |
|---|---|---|---|
| Previous Owner | Crews Jevon M | $57,000 | |
| Closed | Crews Jevon M | $19,000 |
Source: Public Records
Tax History Compared to Growth
Tax History
| Year | Tax Paid | Tax Assessment Tax Assessment Total Assessment is a certain percentage of the fair market value that is determined by local assessors to be the total taxable value of land and additions on the property. | Land | Improvement |
|---|---|---|---|---|
| 2024 | $3,590 | $41,720 | $5,110 | $36,610 |
| 2023 | $1,938 | $41,720 | $5,110 | $36,610 |
| 2022 | $2,400 | $20,930 | $2,100 | $18,830 |
| 2021 | $1,107 | $20,930 | $2,100 | $18,830 |
| 2020 | $1,089 | $20,930 | $2,100 | $18,830 |
| 2019 | $1,115 | $18,380 | $1,820 | $16,560 |
| 2018 | $971 | $18,380 | $1,820 | $16,560 |
| 2017 | $1,013 | $18,380 | $1,820 | $16,560 |
| 2016 | $911 | $13,410 | $2,070 | $11,340 |
| 2015 | $829 | $13,410 | $2,070 | $11,340 |
| 2014 | $831 | $13,410 | $2,070 | $11,340 |
| 2013 | $456 | $14,910 | $2,310 | $12,600 |
Source: Public Records
Map
Nearby Homes
- 1082-1084 Peters Ave
- 940 Shoemaker Ave
- 940-942 Leona Ave
- 1186 Saint Clair Ave
- 927 Camden Ave
- 923 Camden Ave
- 911 Camden Ave
- 1025 Howard St
- 997-999 Gibbard Ave
- 796 Gibbard Ave
- 780-782 Gibbard Ave
- 779 Gibbard Ave
- 810-812 E 3rd Ave
- 773-775 E 3rd Ave
- 0 Leona Ave
- 790-792 E Starr Ave
- 841 Saint Clair Ave
- 0 E 4th Ave
- 276 E 4th Ave
- 1471 Jefferson Ave
- 1121 Peters Ave
- 1111 Peters Ave
- 1129 Peters Ave
- 1103 Peters Ave
- 1133 Peters Ave
- 1097-1099 Peters Ave
- 1097 Peters Ave Unit 99
- 1124 Lexington Ave
- 1120 Lexington Ave
- 1134 Lexington Ave
- 1137 Peters Ave Unit 139
- 1137-1139 Peters Ave
- 1138 Lexington Ave
- 190 Shoemaker Ave
- 1093 Peters Ave
- 1116 Peters Ave
- 1112 Lexington Ave
- 1120 Peters Ave
- 1112 Peters Ave
- 0 Peters Ave