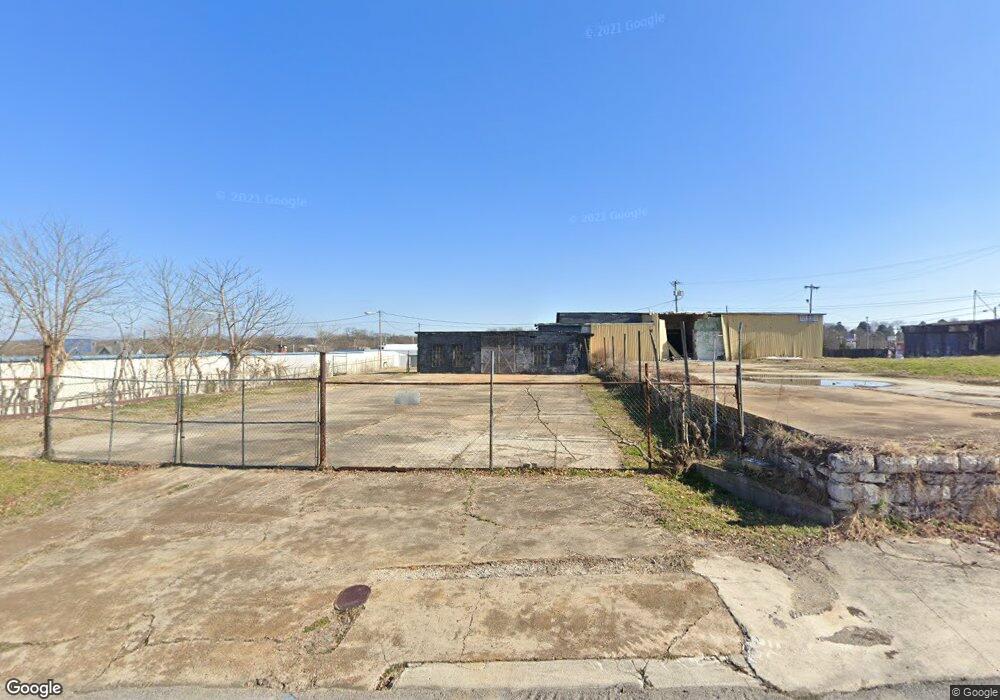
1119 S Garden St Columbia, TN 38401
Estimated Value: $687,372
--
Bed
--
Bath
3,530
Sq Ft
$195/Sq Ft
Est. Value
About This Home
This home is located at 1119 S Garden St, Columbia, TN 38401 and is currently estimated at $687,372, approximately $194 per square foot. 1119 S Garden St is a home located in Maury County with nearby schools including Highland Park Elementary School, Whitthorne Middle School, and Columbia Central High School.
Ownership History
Date
Name
Owned For
Owner Type
Purchase Details
Closed on
Apr 30, 2021
Sold by
K 50 Enterprises Llc
Bought by
Burchell Properties Llc
Current Estimated Value
Purchase Details
Closed on
Mar 8, 2016
Sold by
Square 14 Llc
Bought by
K 50 Enterprises Llc
Home Financials for this Owner
Home Financials are based on the most recent Mortgage that was taken out on this home.
Original Mortgage
$86,000
Interest Rate
3.81%
Mortgage Type
Commercial
Purchase Details
Closed on
Aug 5, 2015
Sold by
Johnson Jeremy C and Johnson Maribeth A
Bought by
Square 14 Llc
Purchase Details
Closed on
May 20, 2015
Sold by
Baker John L
Bought by
Johnson Jeremy C and Johnson Meribeth A
Home Financials for this Owner
Home Financials are based on the most recent Mortgage that was taken out on this home.
Original Mortgage
$83,045
Interest Rate
3.75%
Mortgage Type
New Conventional
Purchase Details
Closed on
Jan 1, 1979
Bought by
Baker John L
Create a Home Valuation Report for This Property
The Home Valuation Report is an in-depth analysis detailing your home's value as well as a comparison with similar homes in the area
Home Values in the Area
Average Home Value in this Area
Purchase History
| Date | Buyer | Sale Price | Title Company |
|---|---|---|---|
| Burchell Properties Llc | $500,000 | None Available | |
| K 50 Enterprises Llc | $110,000 | None Available | |
| Square 14 Llc | -- | None Available | |
| Johnson Jeremy C | $97,700 | None Available | |
| Baker John L | -- | -- |
Source: Public Records
Mortgage History
| Date | Status | Borrower | Loan Amount |
|---|---|---|---|
| Previous Owner | K 50 Enterprises Llc | $86,000 | |
| Previous Owner | Johnson Jeremy C | $83,045 |
Source: Public Records
Tax History Compared to Growth
Tax History
| Year | Tax Paid | Tax Assessment Tax Assessment Total Assessment is a certain percentage of the fair market value that is determined by local assessors to be the total taxable value of land and additions on the property. | Land | Improvement |
|---|---|---|---|---|
| 2024 | $1,776 | $92,960 | $81,400 | $11,560 |
| 2023 | $1,776 | $92,960 | $81,400 | $11,560 |
| 2022 | $2,543 | $92,960 | $81,400 | $11,560 |
| 2021 | $2,543 | $36,920 | $26,840 | $10,080 |
| 2020 | $1,254 | $36,920 | $26,840 | $10,080 |
| 2019 | $856 | $36,920 | $26,840 | $10,080 |
| 2018 | $826 | $36,920 | $26,840 | $10,080 |
| 2017 | $289 | $6,800 | $6,800 | $0 |
| 2016 | $289 | $6,800 | $6,800 | $0 |
| 2015 | $276 | $6,800 | $6,800 | $0 |
| 2014 | -- | $6,800 | $6,800 | $0 |
Source: Public Records
Map
Nearby Homes
- 1119 S High St
- 1115 S High St
- 1109 Parker St
- 106 E 9th St
- 107 E 9th St Unit D-7
- 107 E 9th St Unit C-6
- 107 E 9th St Unit C-5
- 2509 Drumwright Way
- 1919 Hildebrand Ln
- 1400 Highland Ave
- 1009 Woodland St
- 917 S High St
- 1124 Woodland St
- 209 W 13th St
- 211A W 13th St
- 1202 Parker St
- 911 S High St
- 1117 S Glade St
- 311 W 13th St
- 1104 Bridge St
- 1117 S Garden St
- 1135 S Garden St
- 1106 Carmack Blvd
- 1124 Carmack Blvd
- 111 W 11th St
- 1112 S Garden St
- 1116 S Garden St
- 1200 S Main St
- 1114 S Garden St
- 1203 S Garden St
- 1204 S Main St
- 1205 S Garden St
- 1023 S Garden St
- 1021 S Garden St
- 1006 Carmack Blvd
- 209 E 11th St
- 1125 S High St
- 1127 S High St
- 1123 S High St
- 206 Depot St