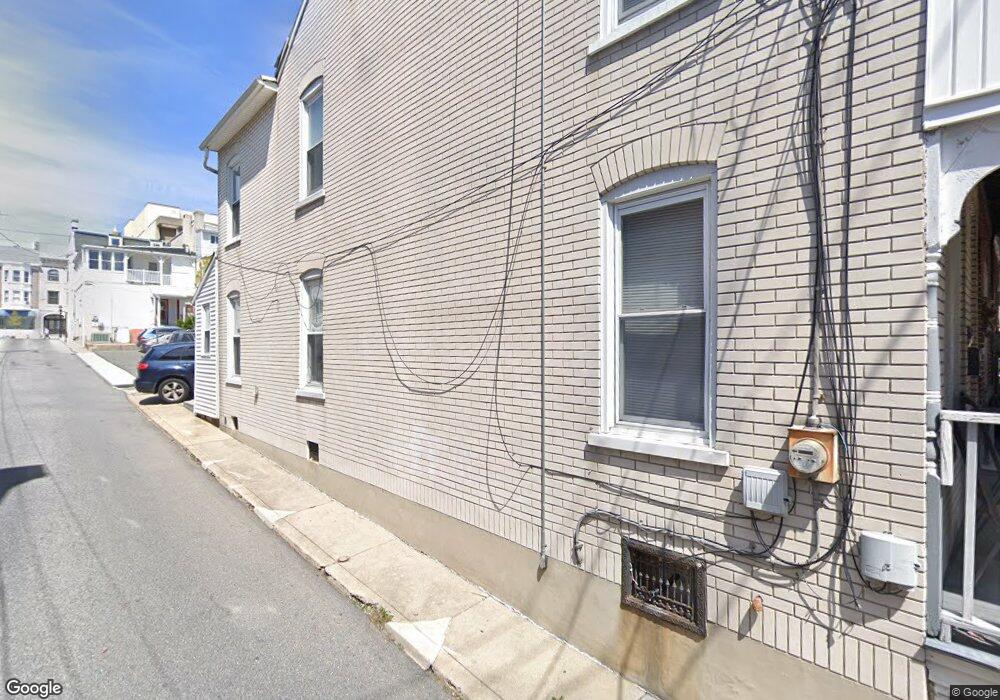
1119 W Maple St Allentown, PA 18102
Center City NeighborhoodEstimated Value: $147,000 - $186,000
3
Beds
1
Bath
1,302
Sq Ft
$125/Sq Ft
Est. Value
About This Home
This home is located at 1119 W Maple St, Allentown, PA 18102 and is currently estimated at $162,602, approximately $124 per square foot. 1119 W Maple St is a home located in Lehigh County with nearby schools including Union Terrace Elementary School, Francis D Raub Middle School, and William Allen High School.
Ownership History
Date
Name
Owned For
Owner Type
Purchase Details
Closed on
Oct 31, 2014
Sold by
First Avenue Group Lp
Bought by
Pas123 Llc
Current Estimated Value
Purchase Details
Closed on
Sep 25, 2009
Sold by
Fannie Mae
Bought by
First Avenue Group
Purchase Details
Closed on
Jul 29, 2005
Sold by
Equitis Group Lp
Bought by
Charles Brooke S
Home Financials for this Owner
Home Financials are based on the most recent Mortgage that was taken out on this home.
Original Mortgage
$54,900
Interest Rate
5.63%
Mortgage Type
Fannie Mae Freddie Mac
Purchase Details
Closed on
Jun 6, 2000
Sold by
Kramer Kenneth W and Kramer Ceil M
Bought by
The Chase Manhattan Bank and Imc Home Equity Loan Trust 1997-7
Purchase Details
Closed on
Sep 5, 1997
Sold by
Dnh Investments Inc
Bought by
Kramer Kenneth W and Kramer Ceil M
Purchase Details
Closed on
Sep 4, 1997
Sold by
Terrence Conlisk A and Terrence Paulette S
Bought by
Dnh Investments Inc
Create a Home Valuation Report for This Property
The Home Valuation Report is an in-depth analysis detailing your home's value as well as a comparison with similar homes in the area
Home Values in the Area
Average Home Value in this Area
Purchase History
| Date | Buyer | Sale Price | Title Company |
|---|---|---|---|
| Pas123 Llc | $32,500 | Penntitle Company | |
| First Avenue Group | $30,000 | -- | |
| Charles Brooke S | $61,000 | -- | |
| The Chase Manhattan Bank | -- | -- | |
| Kramer Kenneth W | $51,300 | -- | |
| Dnh Investments Inc | $21,000 | -- |
Source: Public Records
Mortgage History
| Date | Status | Borrower | Loan Amount |
|---|---|---|---|
| Previous Owner | Charles Brooke S | $54,900 |
Source: Public Records
Tax History Compared to Growth
Tax History
| Year | Tax Paid | Tax Assessment Tax Assessment Total Assessment is a certain percentage of the fair market value that is determined by local assessors to be the total taxable value of land and additions on the property. | Land | Improvement |
|---|---|---|---|---|
| 2025 | $1,864 | $57,700 | $4,300 | $53,400 |
| 2024 | $1,864 | $57,700 | $4,300 | $53,400 |
| 2023 | $1,864 | $57,700 | $4,300 | $53,400 |
| 2022 | $1,798 | $57,700 | $53,400 | $4,300 |
| 2021 | $1,762 | $57,700 | $4,300 | $53,400 |
| 2020 | $1,715 | $57,700 | $4,300 | $53,400 |
| 2019 | $1,687 | $57,700 | $4,300 | $53,400 |
| 2018 | $1,577 | $57,700 | $4,300 | $53,400 |
| 2017 | $1,536 | $57,700 | $4,300 | $53,400 |
| 2016 | -- | $57,700 | $4,300 | $53,400 |
| 2015 | -- | $57,700 | $4,300 | $53,400 |
| 2014 | -- | $57,700 | $4,300 | $53,400 |
Source: Public Records
Map
Nearby Homes
- 1138 W Maple St
- 1225 SW Walnut
- 128 S 12th St
- 21 N Jefferson St
- 35 N Jefferson St
- 956 W Maple St
- 36 N Jefferson St
- 112 N Poplar St
- 22 S 13th St
- 24 S 13th St
- 1244 W Union St
- 24 N 13th St
- 131 N Poplar St
- 120 S 13th St
- 932 W Walnut St
- 139 N 11th St
- 42 N 13th St
- 1331 W Maple St
- 1035 W Turner St
- 19 S 14th St
- 1117 W Maple St
- 1121 W Maple St
- 1123 W Maple St
- 23 S Poplar St
- 25 S Poplar St
- 27 S Poplar St
- 1122 W Maple St
- 1126 W Maple St
- 1124 W Maple St
- 1116 W Maple St
- 29 S Poplar St
- 31 S Poplar St
- 1128 W Maple St
- 1114 W Maple St
- 1130 W Maple St
- 33 S Poplar St
- 1132 W Maple St
- 1110 W Maple St
- 1112 W Maple St
- 1116 W Hamilton St Unit 3F, 3rd Floor