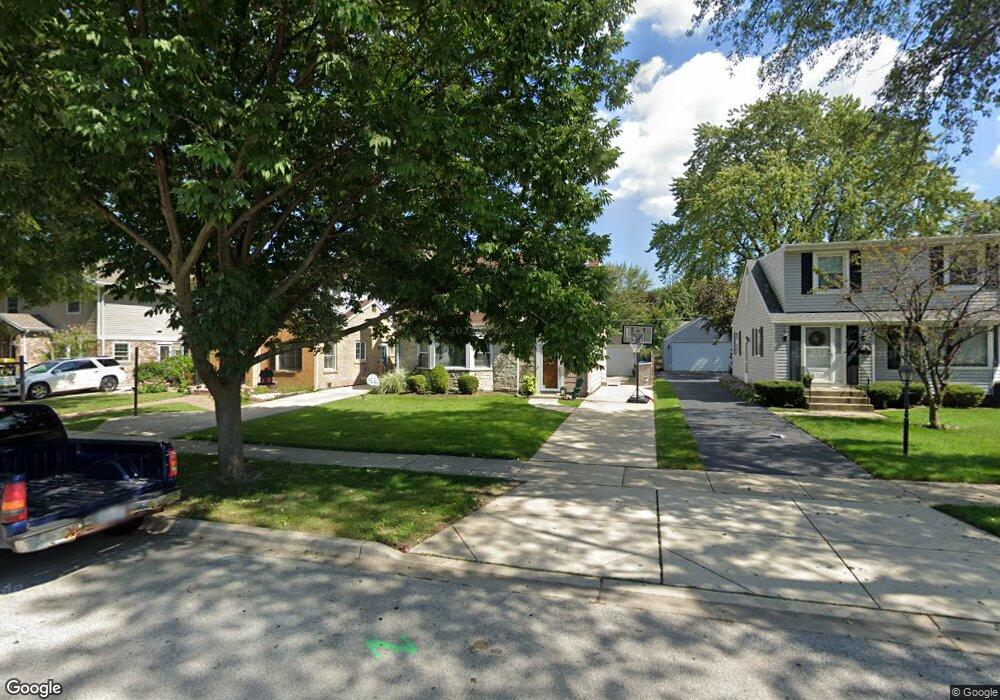
1119 Webster Ln Des Plaines, IL 60016
Estimated Value: $396,000 - $441,000
3
Beds
2
Baths
1,492
Sq Ft
$279/Sq Ft
Est. Value
About This Home
This home is located at 1119 Webster Ln, Des Plaines, IL 60016 and is currently estimated at $416,893, approximately $279 per square foot. 1119 Webster Ln is a home located in Cook County with nearby schools including Forest Elementary School, Algonquin Middle School, and Maine West High School.
Ownership History
Date
Name
Owned For
Owner Type
Purchase Details
Closed on
Dec 27, 2016
Sold by
Karan Celeste Yeager
Bought by
Sebo Kelly and Niederkorn Bradley
Current Estimated Value
Purchase Details
Closed on
Aug 29, 2003
Sold by
Gonigam J Peter and Gonigam Mary G
Bought by
Yeager Karan Alexander L and Yeager Karan Celeste
Home Financials for this Owner
Home Financials are based on the most recent Mortgage that was taken out on this home.
Original Mortgage
$228,000
Interest Rate
5.97%
Mortgage Type
Unknown
Purchase Details
Closed on
Mar 26, 1994
Sold by
Gardner Richard S and Conigam Mary G
Bought by
Conigam Peter and Conigam Mary G
Purchase Details
Closed on
Dec 18, 1993
Sold by
Gardner Sylvia O
Bought by
Gardner Sylvia O and Gardner Richard S
Create a Home Valuation Report for This Property
The Home Valuation Report is an in-depth analysis detailing your home's value as well as a comparison with similar homes in the area
Home Values in the Area
Average Home Value in this Area
Purchase History
| Date | Buyer | Sale Price | Title Company |
|---|---|---|---|
| Sebo Kelly | $245,000 | Attorney | |
| Yeager Karan Alexander L | $285,000 | Mtc | |
| Conigam Peter | $76,500 | -- | |
| Gardner Sylvia O | -- | -- |
Source: Public Records
Mortgage History
| Date | Status | Borrower | Loan Amount |
|---|---|---|---|
| Previous Owner | Yeager Karan Alexander L | $228,000 |
Source: Public Records
Tax History Compared to Growth
Tax History
| Year | Tax Paid | Tax Assessment Tax Assessment Total Assessment is a certain percentage of the fair market value that is determined by local assessors to be the total taxable value of land and additions on the property. | Land | Improvement |
|---|---|---|---|---|
| 2024 | $6,741 | $27,063 | $4,354 | $22,709 |
| 2023 | $6,551 | $28,882 | $4,354 | $24,528 |
| 2022 | $6,551 | $28,882 | $4,354 | $24,528 |
| 2021 | $5,148 | $20,077 | $3,483 | $16,594 |
| 2020 | $5,130 | $20,077 | $3,483 | $16,594 |
| 2019 | $5,081 | $22,308 | $3,483 | $18,825 |
| 2018 | $6,526 | $25,258 | $3,047 | $22,211 |
| 2017 | $6,429 | $25,258 | $3,047 | $22,211 |
| 2016 | $6,325 | $25,258 | $3,047 | $22,211 |
| 2015 | $6,297 | $23,452 | $2,612 | $20,840 |
| 2014 | $6,180 | $23,452 | $2,612 | $20,840 |
| 2013 | $6,009 | $23,452 | $2,612 | $20,840 |
Source: Public Records
Map
Nearby Homes
- 1056 E Villa Dr
- 1157 W Grant Dr
- 1394 Carol Ln
- 911 E Villa Dr
- 858 E Grant Dr
- 881 E Thacker St
- 886 E Thacker St
- 991 Wicke Ave
- 915 Graceland Ave Unit 1E
- 1205 S Wolf Rd
- 714 E Thacker St
- 1050 E Oakton St
- 1380 Oakwood Ave Unit 306
- 1365 Ashland Ave Unit 302
- 799 Graceland Ave Unit 504A
- 906 Alfini Dr
- 905 Center St Unit B507
- 905 Center St Unit B208
- 648 1st Ave
- 807 Fairmont Ct
- 1111 Webster Ln
- 1125 Webster Ln
- 1129 Webster Ln
- 1103 Webster Ln
- 1137 Webster Ln
- 1095 Webster Ln
- 1114 S 2nd Ave
- 1126 S 2nd Ave
- 1110 S 2nd Ave
- 1132 S 2nd Ave
- 1098 S 2nd Ave
- 1089 Webster Ln
- 1141 Webster Ln
- 1120 Webster Ln
- 1114 Webster Ln
- 1128 Webster Ln
- 1090 S 2nd Ave
- 1106 Webster Ln
- 1147 Webster Ln
- 1083 Webster Ln