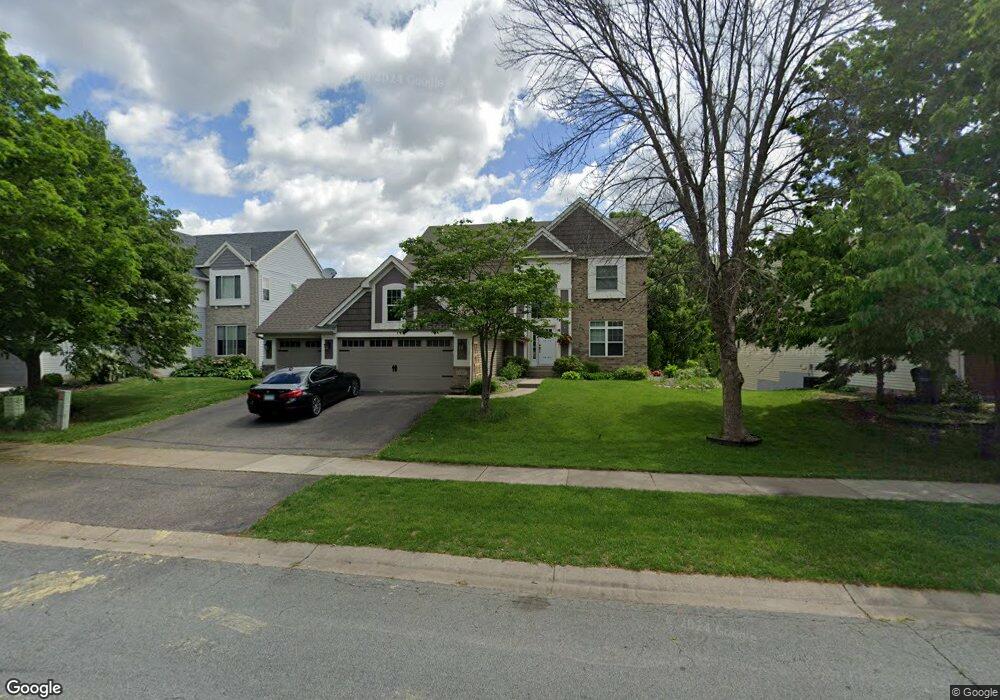
11197 Nassau Cir NE Minneapolis, MN 55449
Estimated Value: $537,387 - $684,000
5
Beds
4
Baths
2,436
Sq Ft
$244/Sq Ft
Est. Value
About This Home
This home is located at 11197 Nassau Cir NE, Minneapolis, MN 55449 and is currently estimated at $594,097, approximately $243 per square foot. 11197 Nassau Cir NE is a home located in Anoka County with nearby schools including Northpoint Elementary School, Westwood Intermediate and Middle School, and Innovation Science & Tech Academy.
Ownership History
Date
Name
Owned For
Owner Type
Purchase Details
Closed on
Apr 30, 2016
Sold by
Trantan Thomas and Trantan Ngoc
Bought by
Abu Sara Salman Sulelman
Current Estimated Value
Purchase Details
Closed on
Apr 11, 2014
Sold by
Trantan Thomas and Trantan Melissa Ngoc
Bought by
Abu Sara Salman Suleiman
Home Financials for this Owner
Home Financials are based on the most recent Mortgage that was taken out on this home.
Original Mortgage
$279,000
Interest Rate
4.31%
Mortgage Type
Seller Take Back
Purchase Details
Closed on
Jan 25, 2002
Sold by
Douskey Robin L and Douskey Jennifer A G
Bought by
Trantan Thomas and Trantan Ngoc
Purchase Details
Closed on
Nov 30, 1999
Sold by
The Rottlund Company
Bought by
Douskey Robin L and Douskey Jennifer A G
Purchase Details
Closed on
Jul 19, 1999
Sold by
Sienna Corp
Bought by
The Rottlund Company
Create a Home Valuation Report for This Property
The Home Valuation Report is an in-depth analysis detailing your home's value as well as a comparison with similar homes in the area
Home Values in the Area
Average Home Value in this Area
Purchase History
| Date | Buyer | Sale Price | Title Company |
|---|---|---|---|
| Abu Sara Salman Sulelman | $273,000 | Servicelink | |
| Abu Sara Salman Suleiman | $310,000 | None Available | |
| Trantan Thomas | $355,000 | -- | |
| Douskey Robin L | $289,599 | -- | |
| The Rottlund Company | $46,900 | -- |
Source: Public Records
Mortgage History
| Date | Status | Borrower | Loan Amount |
|---|---|---|---|
| Previous Owner | Abu Sara Salman Suleiman | $279,000 |
Source: Public Records
Tax History Compared to Growth
Tax History
| Year | Tax Paid | Tax Assessment Tax Assessment Total Assessment is a certain percentage of the fair market value that is determined by local assessors to be the total taxable value of land and additions on the property. | Land | Improvement |
|---|---|---|---|---|
| 2025 | $5,538 | $519,300 | $115,800 | $403,500 |
| 2024 | $5,538 | $497,000 | $106,200 | $390,800 |
| 2023 | $4,929 | $501,800 | $106,200 | $395,600 |
| 2022 | $4,782 | $489,600 | $86,900 | $402,700 |
| 2021 | $4,648 | $408,400 | $79,500 | $328,900 |
| 2020 | $4,651 | $390,300 | $79,500 | $310,800 |
| 2019 | $4,492 | $373,500 | $67,000 | $306,500 |
| 2018 | $4,598 | $352,100 | $0 | $0 |
| 2017 | $4,329 | $344,100 | $0 | $0 |
| 2016 | $4,430 | $318,200 | $0 | $0 |
| 2015 | -- | $318,200 | $74,600 | $243,600 |
| 2014 | -- | $284,500 | $71,000 | $213,500 |
Source: Public Records
Map
Nearby Homes
- 1842 111th Ave NE
- 1824 111th Ave NE
- 1806 111th Ave NE
- 11030 Amen Cir NE
- 11505 Palisade Ct NE
- 11508 Arnold Palmer Dr
- 2464 Tournament Players Cir N
- 11316 Fergus St NE Unit E
- 11345 Fergus St NE Unit D
- 2535 110th Ct NE
- 11132 Club West Cir Unit A
- 2634 Tournament Players Cir N
- 11125 Baltimore St NE Unit L
- 11064 Zumbrota Ct NE
- 1481 111th Ln NE Unit G
- 11358 Chisholm Cir NE Unit E
- 2255 119th Cir NE
- 1635 117th Ave NE
- 2348 119th Cir NE
- 11598 Yancy Ct NE
- 11203 Nassau Cir NE
- 11185 Nassau Cir NE
- 11215 Nassau Cir NE
- 11173 Nassau Cir NE
- 11212 Nassau Cir NE
- 11198 Nassau Cir NE
- 11186 Nassau Cir NE
- 11227 Nassau Cir NE
- 11174 Nassau Cir NE
- 11161 Nassau Cir NE
- 11224 Nassau Cir NE
- 11162 Nassau Cir NE
- 11239 Nassau Cir NE
- 11238 Nassau Cir NE
- 11149 Nassau Cir NE
- 11150 Nassau Cir NE
- 11248 Nassau Cir NE
- 11251 Nassau Cir NE
- 11138 Nassau Cir NE
- 2002 112th Cir NE