11198 China Ct Penn Valley, CA 95946
Estimated Value: $668,000 - $800,505
3
Beds
3
Baths
--
Sq Ft
32.1
Acres
About This Home
This home is located at 11198 China Ct, Penn Valley, CA 95946 and is currently estimated at $721,835. 11198 China Ct is a home located in Nevada County with nearby schools including Ready Springs Elementary School and Williams Ranch Elementary School.
Ownership History
Date
Name
Owned For
Owner Type
Purchase Details
Closed on
Aug 22, 2017
Sold by
Cullins William M and Cullins Niran R
Bought by
Cullins William M and Cullins Niran R
Current Estimated Value
Home Financials for this Owner
Home Financials are based on the most recent Mortgage that was taken out on this home.
Original Mortgage
$954,225
Outstanding Balance
$806,932
Interest Rate
4.47%
Mortgage Type
Reverse Mortgage Home Equity Conversion Mortgage
Estimated Equity
-$85,097
Purchase Details
Closed on
Apr 18, 2011
Sold by
Cullins William Michael and Cullins Niran R
Bought by
Cullins William M and Cullins Niran R
Purchase Details
Closed on
Jan 11, 2002
Sold by
Cullins William Michael and Cullins Niran R
Bought by
Cullins William Michael and Cullins Niran R
Purchase Details
Closed on
Sep 18, 2000
Sold by
Hess Robert E and Hess Bonnie L
Bought by
Cullins William Michael and Cullins Niran R
Create a Home Valuation Report for This Property
The Home Valuation Report is an in-depth analysis detailing your home's value as well as a comparison with similar homes in the area
Home Values in the Area
Average Home Value in this Area
Purchase History
| Date | Buyer | Sale Price | Title Company |
|---|---|---|---|
| Cullins William M | -- | Fidelity National Title Grou | |
| Cullins William M | -- | None Available | |
| Cullins William Michael | -- | -- | |
| Cullins William Michael | $68,500 | California Land Title Co |
Source: Public Records
Mortgage History
| Date | Status | Borrower | Loan Amount |
|---|---|---|---|
| Open | Cullins William M | $954,225 |
Source: Public Records
Tax History Compared to Growth
Tax History
| Year | Tax Paid | Tax Assessment Tax Assessment Total Assessment is a certain percentage of the fair market value that is determined by local assessors to be the total taxable value of land and additions on the property. | Land | Improvement |
|---|---|---|---|---|
| 2025 | $4,853 | $453,751 | $103,205 | $350,546 |
| 2024 | $4,761 | $444,855 | $101,182 | $343,673 |
| 2023 | $4,761 | $436,134 | $99,199 | $336,935 |
| 2022 | $4,661 | $427,583 | $97,254 | $330,329 |
| 2021 | $4,539 | $419,200 | $95,348 | $323,852 |
| 2020 | $4,527 | $414,903 | $94,371 | $320,532 |
| 2019 | $4,434 | $406,769 | $92,521 | $314,248 |
| 2018 | $4,347 | $398,794 | $90,707 | $308,087 |
| 2017 | $4,262 | $390,976 | $88,929 | $302,047 |
| 2016 | $4,107 | $383,311 | $87,186 | $296,125 |
| 2015 | $4,048 | $377,555 | $85,877 | $291,678 |
| 2014 | $3,984 | $370,160 | $84,195 | $285,965 |
Source: Public Records
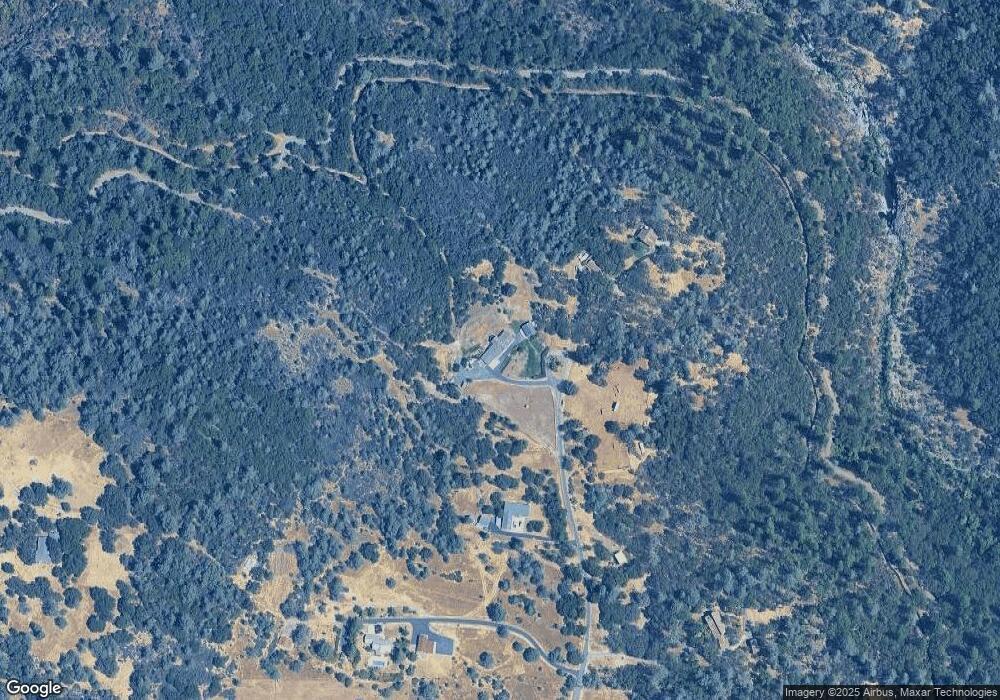
Map
Nearby Homes
- 21323 Bald Ridge Dr
- 20254 Wildwood Dr W
- 20564 Wildwood Dr W
- 11076 Houghton Ranch Rd
- 19600 Martinsburg Ln
- 20197 Chaparral Cir
- 20003 Echo Blue Dr
- 11461 Buckeye Ct
- 20058 Echo Blue Dr
- 20652 Chaparral Cir
- 19100 W Ridge Dr
- 11965 Marble Ct
- 19625 Tara Ln
- 19238 Branding Iron Rd
- 10135 Vista Point Loop
- 19662 Chaparral Cir
- 10932 Oak Canyon Dr
- 10107 Park View Ln
- 10988 Pleasant Valley Rd
- 18905 W Ridge Dr
- 11130 China Ct
- 11199 China Ct
- 11054 China Ct
- 11161 China Ct
- 11085 China Ct
- 10714 Houghton Ranch Rd
- 10979 China Ct
- 20892 Bald Ridge Dr
- 10881 China Ct
- 10614 Houghton Ranch Rd
- 20047 Wildwood West Dr
- 11854 Hitchin Post Ct
- 20375 Wildwood West Dr
- 20907 Bald Ridge Dr
- 10075 Houghton Ranch Rd
- 10235 Houghton Ranch Rd
- 10925 Houghton Ranch Rd