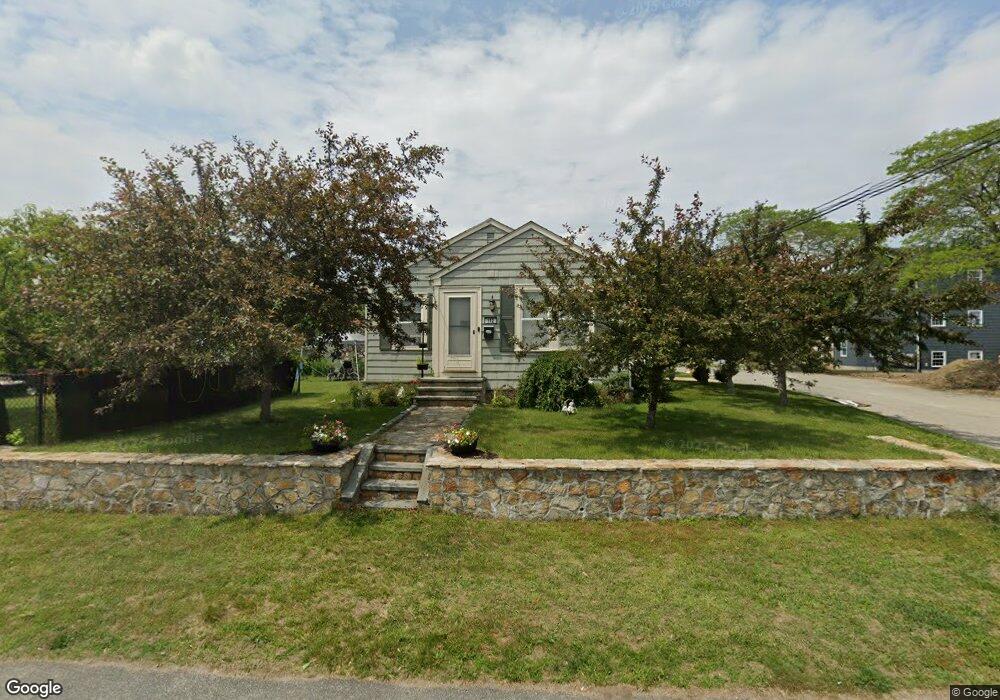
112 2nd Ave Cranston, RI 02910
Park View NeighborhoodEstimated Value: $288,634 - $362,000
2
Beds
1
Bath
936
Sq Ft
$354/Sq Ft
Est. Value
About This Home
This home is located at 112 2nd Ave, Cranston, RI 02910 and is currently estimated at $331,409, approximately $354 per square foot. 112 2nd Ave is a home located in Providence County with nearby schools including Edgewood Highland Elementary School, Edward S. Rhodes School, and Park View Middle School.
Ownership History
Date
Name
Owned For
Owner Type
Purchase Details
Closed on
Jan 25, 2008
Sold by
Lonardo Catherine D
Bought by
Grurdy Patricia L and Rego Herman
Current Estimated Value
Home Financials for this Owner
Home Financials are based on the most recent Mortgage that was taken out on this home.
Original Mortgage
$184,860
Outstanding Balance
$116,220
Interest Rate
6.17%
Mortgage Type
Purchase Money Mortgage
Estimated Equity
$215,189
Create a Home Valuation Report for This Property
The Home Valuation Report is an in-depth analysis detailing your home's value as well as a comparison with similar homes in the area
Home Values in the Area
Average Home Value in this Area
Purchase History
| Date | Buyer | Sale Price | Title Company |
|---|---|---|---|
| Grurdy Patricia L | $180,000 | -- |
Source: Public Records
Mortgage History
| Date | Status | Borrower | Loan Amount |
|---|---|---|---|
| Open | Grurdy Patricia L | $184,860 | |
| Previous Owner | Grurdy Patricia L | $85,000 |
Source: Public Records
Tax History
| Year | Tax Paid | Tax Assessment Tax Assessment Total Assessment is a certain percentage of the fair market value that is determined by local assessors to be the total taxable value of land and additions on the property. | Land | Improvement |
|---|---|---|---|---|
| 2025 | $3,105 | $223,700 | $92,100 | $131,600 |
| 2024 | $3,045 | $223,700 | $92,100 | $131,600 |
| 2023 | $3,194 | $169,000 | $63,500 | $105,500 |
| 2022 | $3,128 | $169,000 | $63,500 | $105,500 |
| 2021 | $3,042 | $169,000 | $63,500 | $105,500 |
| 2020 | $2,922 | $140,700 | $60,300 | $80,400 |
| 2019 | $2,922 | $140,700 | $60,300 | $80,400 |
| 2018 | $2,855 | $140,700 | $60,300 | $80,400 |
| 2017 | $2,588 | $112,800 | $44,500 | $68,300 |
| 2016 | $2,532 | $112,800 | $44,500 | $68,300 |
| 2015 | $2,532 | $112,800 | $44,500 | $68,300 |
| 2014 | $2,480 | $108,600 | $44,500 | $64,100 |
Source: Public Records
Map
Nearby Homes
- 129 1st Ave
- 25 Sharon St Unit 2
- 65 Perkins Ave
- 10 Woburn St
- 0 Elmwood Ave
- 123 Harrington Ave
- 103 Harper Ave
- 127 Sherwood Ave
- 111 Sherwood Ave
- 171 Sherwood Ave
- 150 Riverside Ave
- 1320 Elmwood Ave
- 136 Sherwood Ave
- 120 Sherwood Ave
- 10 Dale Ave
- 167 Forest Ave
- 1302 Elmwood Ave
- 80 George St
- 555 Park Ave
- 144 Laurens St
Your Personal Tour Guide
Ask me questions while you tour the home.