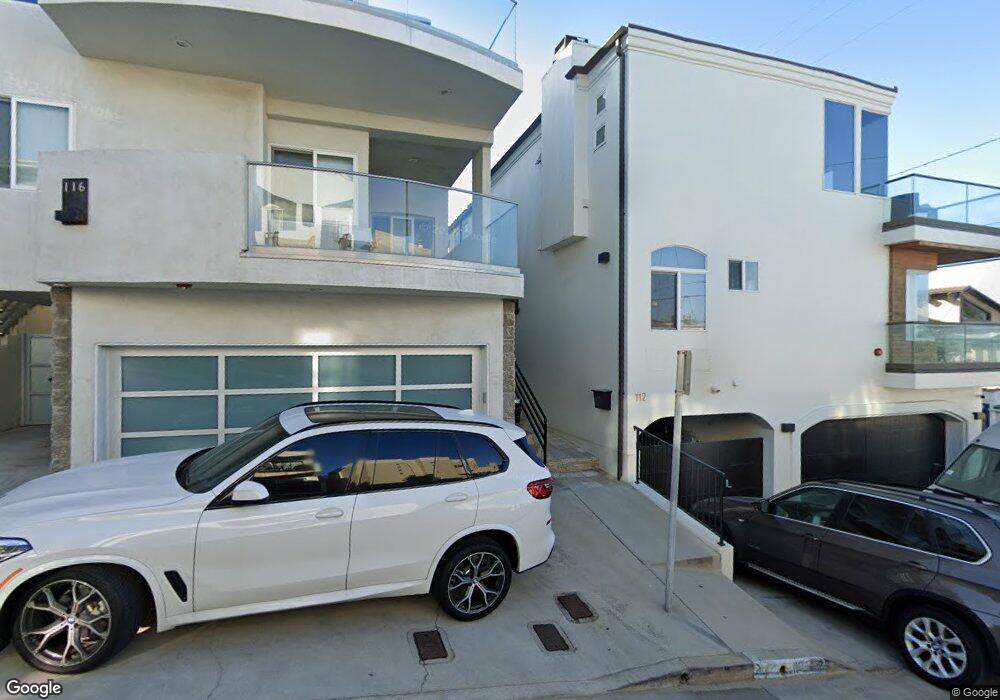
112 40th St Manhattan Beach, CA 90266
Estimated Value: $3,230,000 - $4,444,000
4
Beds
4
Baths
2,580
Sq Ft
$1,493/Sq Ft
Est. Value
About This Home
This home is located at 112 40th St, Manhattan Beach, CA 90266 and is currently estimated at $3,851,234, approximately $1,492 per square foot. 112 40th St is a home located in Los Angeles County with nearby schools including Grand View Elementary School, Manhattan Beach Middle School, and Mira Costa High School.
Ownership History
Date
Name
Owned For
Owner Type
Purchase Details
Closed on
Jun 23, 2008
Sold by
Trejo Alejandro C and Trejo Kelly D
Bought by
Trejo Alex
Current Estimated Value
Purchase Details
Closed on
Aug 23, 2001
Sold by
Trejo Alejandro C and Trejo Kelly D
Bought by
Trejo Alejandro C
Purchase Details
Closed on
Feb 24, 2000
Sold by
3912 Ocean Drive Llc
Bought by
Trejo Alejandro
Home Financials for this Owner
Home Financials are based on the most recent Mortgage that was taken out on this home.
Original Mortgage
$1,000,000
Interest Rate
8.62%
Create a Home Valuation Report for This Property
The Home Valuation Report is an in-depth analysis detailing your home's value as well as a comparison with similar homes in the area
Home Values in the Area
Average Home Value in this Area
Purchase History
| Date | Buyer | Sale Price | Title Company |
|---|---|---|---|
| Trejo Alex | -- | None Available | |
| Trejo Alejandro C | -- | Chicago Title Co | |
| Trejo Alejandro | $1,257,500 | North American Title Co |
Source: Public Records
Mortgage History
| Date | Status | Borrower | Loan Amount |
|---|---|---|---|
| Previous Owner | Trejo Alejandro | $1,000,000 | |
| Closed | Trejo Alejandro | $125,000 |
Source: Public Records
Tax History
| Year | Tax Paid | Tax Assessment Tax Assessment Total Assessment is a certain percentage of the fair market value that is determined by local assessors to be the total taxable value of land and additions on the property. | Land | Improvement |
|---|---|---|---|---|
| 2025 | $23,518 | $1,932,737 | $1,471,656 | $461,081 |
| 2024 | $23,518 | $1,894,841 | $1,442,800 | $452,041 |
| 2023 | $22,946 | $1,857,688 | $1,414,510 | $443,178 |
| 2022 | $22,575 | $1,821,264 | $1,386,775 | $434,489 |
| 2021 | $22,222 | $1,785,554 | $1,359,584 | $425,970 |
| 2019 | $19,933 | $1,732,596 | $1,319,259 | $413,337 |
| 2018 | $19,542 | $1,698,625 | $1,293,392 | $405,233 |
| 2016 | $18,138 | $1,632,668 | $1,243,169 | $389,499 |
| 2015 | $17,762 | $1,608,145 | $1,224,496 | $383,649 |
| 2014 | $17,512 | $1,576,644 | $1,200,510 | $376,134 |
Source: Public Records
Map
Nearby Homes
- 113 El Porto St Unit 2
- 113 El Porto St
- 119 El Porto St
- 116 40th St
- 116 40th St Unit S
- 116 40th St
- 123 El Porto St Unit Upper
- 123 El Porto St Unit Upper unit
- 123 El Porto St Unit Main floor unit
- 123 El Porto St
- 120 40th St
- 3929 The Strand
- 125 El Porto St
- 125 El Porto St Unit n/a
- 125 El Porto St
- 3904 Ocean Dr
- 126 40th St
- 120 El Porto St
- 4006 Ocean Dr
- 119 40th St
Your Personal Tour Guide
Ask me questions while you tour the home.