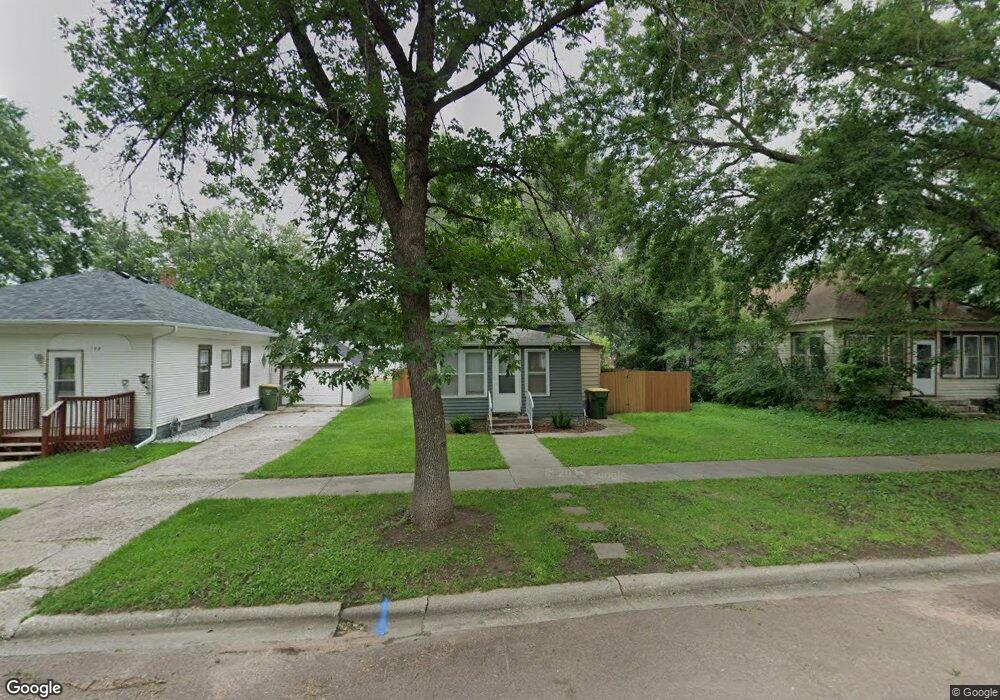
112 8th St E Jasper, MN 56144
Estimated Value: $63,000 - $119,000
2
Beds
1
Bath
1,304
Sq Ft
$75/Sq Ft
Est. Value
About This Home
This home is located at 112 8th St E, Jasper, MN 56144 and is currently estimated at $98,000, approximately $75 per square foot. 112 8th St E is a home located in Pipestone County with nearby schools including Brown Elementary School, Pipestone Elementary School, and Pipestone Head Start.
Ownership History
Date
Name
Owned For
Owner Type
Purchase Details
Closed on
Feb 26, 2025
Sold by
Zapata Perez Pablo Alejandro
Bought by
Lopez Adrian De Loerai
Current Estimated Value
Purchase Details
Closed on
Jun 2, 2021
Sold by
Deloera Deloera Jose Miguel Jose Miguel
Bought by
Zapata Perez Pablo Alejandro
Purchase Details
Closed on
Jan 18, 2016
Sold by
Adams Scott Scott
Bought by
Deloera De Loera Jose Jose
Purchase Details
Closed on
Jun 24, 2014
Sold by
Minnesota Housing Finance Agency
Bought by
Adams Scott D and Adams Peggy J
Purchase Details
Closed on
Oct 19, 2007
Sold by
Boeve Rick and Boeve Grace A
Bought by
Sunderland Nathan A
Home Financials for this Owner
Home Financials are based on the most recent Mortgage that was taken out on this home.
Original Mortgage
$23,050
Interest Rate
6.44%
Create a Home Valuation Report for This Property
The Home Valuation Report is an in-depth analysis detailing your home's value as well as a comparison with similar homes in the area
Purchase History
| Date | Buyer | Sale Price | Title Company |
|---|---|---|---|
| Lopez Adrian De Loerai | $25,000 | Pipestone Abstract & Title | |
| Zapata Perez Pablo Alejandro | -- | None Listed On Document | |
| Deloera De Loera Jose Jose | $6,000 | -- | |
| Deloera Jose Miguel De Loera | $6,000 | None Available | |
| Adams Scott D | -- | None Available | |
| Sunderland Nathan A | -- | -- |
Source: Public Records
Mortgage History
| Date | Status | Borrower | Loan Amount |
|---|---|---|---|
| Previous Owner | Sunderland Nathan A | $23,050 |
Source: Public Records
Tax History
| Year | Tax Paid | Tax Assessment Tax Assessment Total Assessment is a certain percentage of the fair market value that is determined by local assessors to be the total taxable value of land and additions on the property. | Land | Improvement |
|---|---|---|---|---|
| 2025 | $934 | $33,400 | $7,800 | $25,600 |
| 2024 | $934 | $25,500 | $5,200 | $20,300 |
| 2023 | $298 | $20,900 | $5,200 | $15,700 |
| 2022 | $670 | $17,800 | $4,000 | $13,800 |
| 2021 | $290 | $16,600 | $4,000 | $12,600 |
| 2020 | $272 | $16,200 | $4,000 | $12,200 |
| 2019 | $260 | $13,700 | $4,000 | $9,700 |
| 2018 | $268 | $12,900 | $4,000 | $8,900 |
| 2017 | $198 | $12,900 | $4,000 | $8,900 |
| 2016 | $234 | $0 | $0 | $0 |
| 2015 | $1,336 | $17,200 | $3,500 | $13,700 |
| 2014 | $1,336 | $14,300 | $3,500 | $10,800 |
Source: Public Records
Map
Nearby Homes
- 500 Sherman Ave N
- 508 Sherman Ave N
- 100 8th St E
- 509 Sherman Ave N
- 104 8th St E
- 113 8th St W
- 516 Sherman Ave N
- 420 Sherman Ave N
- 108 8th St E
- 521 Sherman Ave N
- 101 101 8th St E
- 101 101 8th-Street-e
- 520 Sherman Ave N
- 105 8th St W
- 101 8th St E
- 109 8th St W
- 109 10th St E
- 109 8th St E
- 113 10th St W
- 116 8th St E
Your Personal Tour Guide
Ask me questions while you tour the home.