Estimated Value: $8,614,000 - $11,670,981
5
Beds
6
Baths
4,714
Sq Ft
$2,094/Sq Ft
Est. Value
About This Home
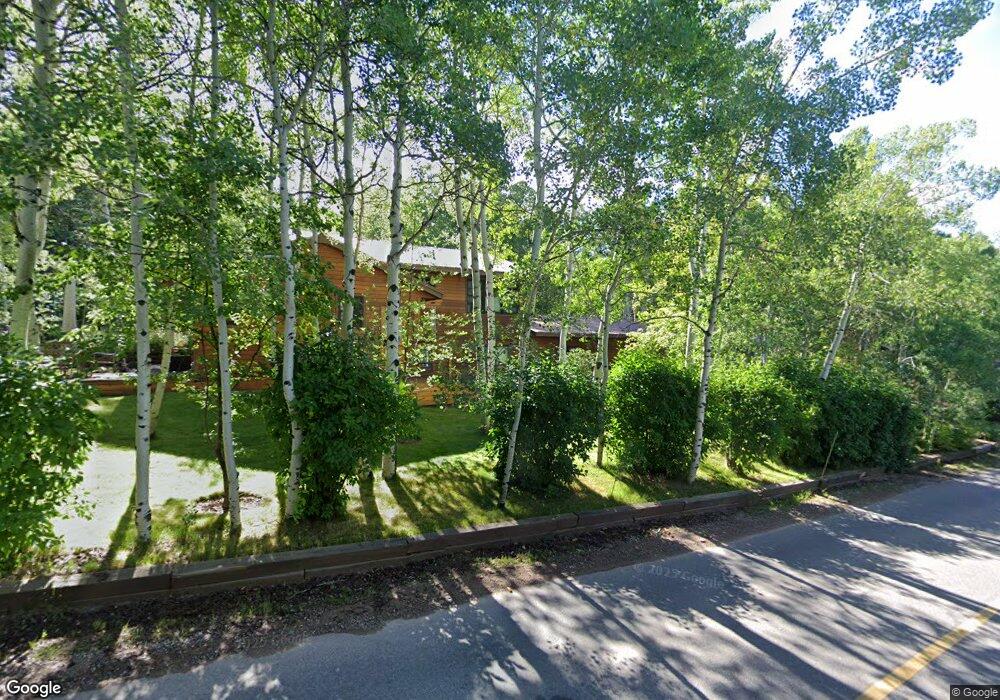
This home is located at 112 Aspen Grove Rd, Aspen, CO 81611 and is currently estimated at $9,872,660, approximately $2,094 per square foot. 112 Aspen Grove Rd is a home located in Pitkin County with nearby schools including Aspen Elementary School, Aspen Middle School, and Aspen High School.
Ownership History
Date
Name
Owned For
Owner Type
Purchase Details
Closed on
Nov 2, 2012
Sold by
Rudolph James A and Rudolph Louisa F
Bought by
James A Rudolph Secon Qualified Personal and Louisa Rudolph Second Qualified Personal
Current Estimated Value
Purchase Details
Closed on
Jun 1, 2010
Sold by
Jabilla Holdings Llc
Bought by
Rudolph James A and Rudolph Louisa F
Purchase Details
Closed on
Jun 23, 2008
Sold by
Likover 1994 Family Lp
Bought by
Jabilla Holdings Llc
Home Financials for this Owner
Home Financials are based on the most recent Mortgage that was taken out on this home.
Original Mortgage
$7,005,673
Interest Rate
5%
Mortgage Type
Purchase Money Mortgage
Purchase Details
Closed on
Mar 1, 2000
Sold by
Muckenhirn David
Bought by
Likover 1994 Family Ltd Partnership
Create a Home Valuation Report for This Property
The Home Valuation Report is an in-depth analysis detailing your home's value as well as a comparison with similar homes in the area
Home Values in the Area
Average Home Value in this Area
Purchase History
| Date | Buyer | Sale Price | Title Company |
|---|---|---|---|
| James A Rudolph Secon Qualified Personal | -- | None Available | |
| Rudolph James A | $6,409,400 | None Available | |
| Jabilla Holdings Llc | $6,925,000 | None Available | |
| Likover 1994 Family Ltd Partnership | $3,181,600 | -- |
Source: Public Records
Mortgage History
| Date | Status | Borrower | Loan Amount |
|---|---|---|---|
| Previous Owner | Jabilla Holdings Llc | $7,005,673 |
Source: Public Records
Tax History
| Year | Tax Paid | Tax Assessment Tax Assessment Total Assessment is a certain percentage of the fair market value that is determined by local assessors to be the total taxable value of land and additions on the property. | Land | Improvement |
|---|---|---|---|---|
| 2025 | $29,482 | $790,660 | $218,750 | $571,910 |
| 2024 | $29,482 | $798,700 | $220,080 | $578,620 |
| 2023 | $26,479 | $809,160 | $222,970 | $586,190 |
| 2022 | $16,727 | $451,780 | $145,950 | $305,830 |
| 2021 | $16,656 | $464,790 | $150,150 | $314,640 |
| 2020 | $13,768 | $381,360 | $117,980 | $263,380 |
| 2019 | $13,768 | $381,360 | $117,980 | $263,380 |
| 2018 | $13,825 | $384,020 | $118,800 | $265,220 |
| 2017 | $12,206 | $379,120 | $115,200 | $263,920 |
| 2016 | $9,228 | $280,800 | $115,420 | $165,380 |
| 2015 | $9,110 | $280,800 | $115,420 | $165,380 |
| 2014 | $8,543 | $251,610 | $139,300 | $112,310 |
Source: Public Records
Map
Nearby Homes
- 1345 Mayflower Ct
- 96 McSkimming Rd
- 100 Park Ave
- 1195 E Cooper Ave Unit A
- 82 Northway Dr
- 71 & 73 Smuggler Grove Rd
- 63 Smuggler Grove
- 1212 E Hopkins Ave
- 552 Mountain Laurel Dr
- 1039 E Cooper Ave Unit 16A
- 1039 E Cooper Ave Unit 36B
- 190 W Lupine Dr
- 326 Midland Ave Unit 302
- 326 Midland Ave Unit 308
- 326 Midland Ave Unit 306
- 322 Park Ave Unit 1
- 322 Park Ave Unit 2
- 1024 E Cooper Ave Unit 2
- 1001 E Cooper Ave Unit 1
- 602 Mountain Laurel Dr
- 52 McSkimming Rd
- 310 Eastwood Dr
- 32 McSkimming Rd
- 113 Aspen Grove Rd
- 24 McSkimming Rd
- 24 McSkimming Rd Unit A
- 322 Eastwood Dr
- 184 McSkimming Rd
- 214 McSkimming Rd
- 173 McSkimming Rd
- 1390 Mayflower Ct
- 16 McSkimming Rd
- 177 McSkimming Rd
- 1365 Mayflower Ct
- 340 Eastwood Dr
- 281 Eastwood Dr
- 302 Eastwood Dr
- 345 Eastwood Rd
- 21 Alice Ln
- 277 Eastwood Rd
Your Personal Tour Guide
Ask me questions while you tour the home.