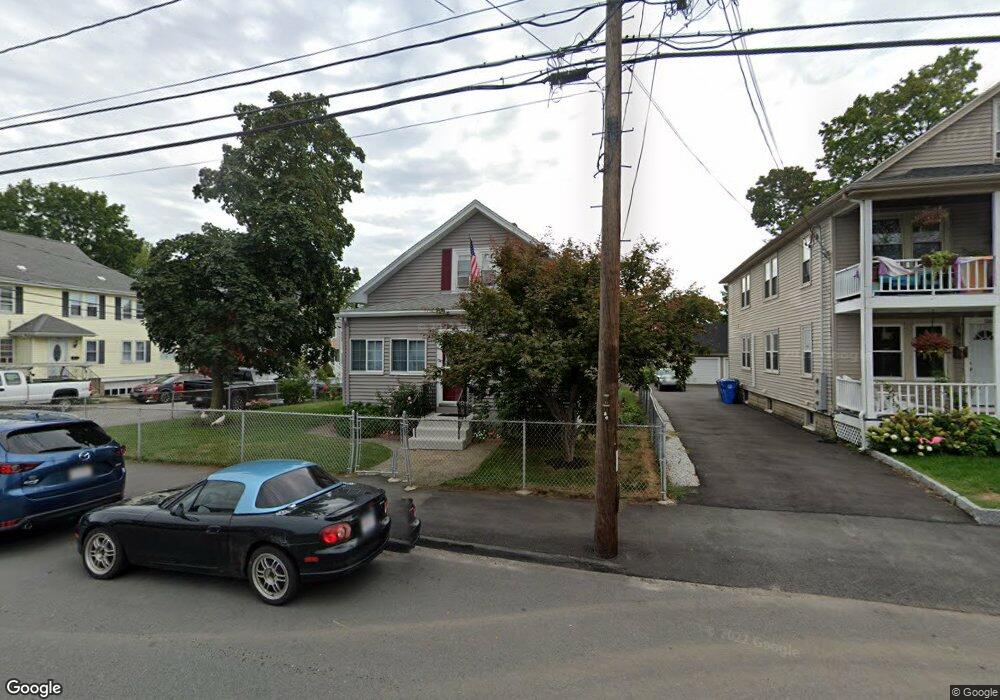
112 Bright St Waltham, MA 02453
Bleachery NeighborhoodEstimated Value: $700,000 - $782,000
3
Beds
1
Bath
1,176
Sq Ft
$630/Sq Ft
Est. Value
About This Home
This home is located at 112 Bright St, Waltham, MA 02453 and is currently estimated at $740,948, approximately $630 per square foot. 112 Bright St is a home located in Middlesex County with nearby schools including James Fitzgerald Elementary School, John W. Mcdevitt Middle School, and Waltham Sr High School.
Ownership History
Date
Name
Owned For
Owner Type
Purchase Details
Closed on
Aug 8, 2018
Sold by
Arsenault Victor J and Arsenault Eleanor M
Bought by
Arsenault Ft 2018
Current Estimated Value
Purchase Details
Closed on
Dec 21, 1992
Sold by
Alongi Rosemarie
Bought by
Arsenault Victor
Home Financials for this Owner
Home Financials are based on the most recent Mortgage that was taken out on this home.
Original Mortgage
$110,000
Interest Rate
8.3%
Mortgage Type
Purchase Money Mortgage
Purchase Details
Closed on
Oct 27, 1992
Sold by
Edmund P White Est
Bought by
Alongi Rosemarie
Home Financials for this Owner
Home Financials are based on the most recent Mortgage that was taken out on this home.
Original Mortgage
$110,000
Interest Rate
8.3%
Mortgage Type
Purchase Money Mortgage
Create a Home Valuation Report for This Property
The Home Valuation Report is an in-depth analysis detailing your home's value as well as a comparison with similar homes in the area
Home Values in the Area
Average Home Value in this Area
Purchase History
| Date | Buyer | Sale Price | Title Company |
|---|---|---|---|
| Arsenault Ft 2018 | -- | -- | |
| Arsenault Victor | $125,000 | -- | |
| Alongi Rosemarie | $118,000 | -- |
Source: Public Records
Mortgage History
| Date | Status | Borrower | Loan Amount |
|---|---|---|---|
| Previous Owner | Alongi Rosemarie | $110,700 | |
| Previous Owner | Alongi Rosemarie | $110,000 |
Source: Public Records
Tax History
| Year | Tax Paid | Tax Assessment Tax Assessment Total Assessment is a certain percentage of the fair market value that is determined by local assessors to be the total taxable value of land and additions on the property. | Land | Improvement |
|---|---|---|---|---|
| 2025 | $5,949 | $605,800 | $375,300 | $230,500 |
| 2024 | $5,817 | $603,400 | $375,300 | $228,100 |
| 2023 | $5,471 | $530,100 | $340,600 | $189,500 |
| 2022 | $5,822 | $522,600 | $340,600 | $182,000 |
| 2021 | $5,248 | $463,600 | $291,900 | $171,700 |
| 2020 | $5,039 | $421,700 | $264,100 | $157,600 |
| 2019 | $4,954 | $391,300 | $255,200 | $136,100 |
| 2018 | $4,425 | $350,900 | $236,300 | $114,600 |
| 2017 | $4,146 | $330,100 | $215,500 | $114,600 |
| 2016 | $3,955 | $323,100 | $208,500 | $114,600 |
| 2015 | $4,167 | $317,400 | $205,000 | $112,400 |
Source: Public Records
Map
Nearby Homes
- 126 Bright St
- 56-58 Dix St
- 19 School Ave Unit 2
- 220 Grove St Unit 1
- 266-274 River St
- 176 River St
- 136 Willow St
- 10 Naviens Ln Unit 2
- 10 Naviens Ln Unit 1
- 301 River St
- 157 Grove St Unit 2
- 28-32 Calvary St
- 20 Townsend St
- 26 Friend St
- 59 Farnum Rd
- 40 Grove St Unit 1
- 22 Grove St Unit 2
- 308 Newton St Unit 1
- 312 Newton St Unit 1A
- 31 Hall St Unit 2
- 116 Bright St
- 74 Bennett St
- 104-106 Bright St
- 104 Bright St Unit 106
- 81 Bennett St
- 106 Bright St Unit 2
- 120 Bright St
- 120 Bright St Unit 2
- 120 Bright St Unit 1
- 70 Bennett St
- 73 Bennett St Unit 1
- 109 Bright St Unit 3
- 109 Bright St Unit 1
- 109 Bright St Unit 2
- 111 Bright St
- 109 Bright St
- 73 Bennett St Unit 2
- 77 Bennett St Unit 79
- 100 Bright St
- 75 Dix St
Your Personal Tour Guide
Ask me questions while you tour the home.