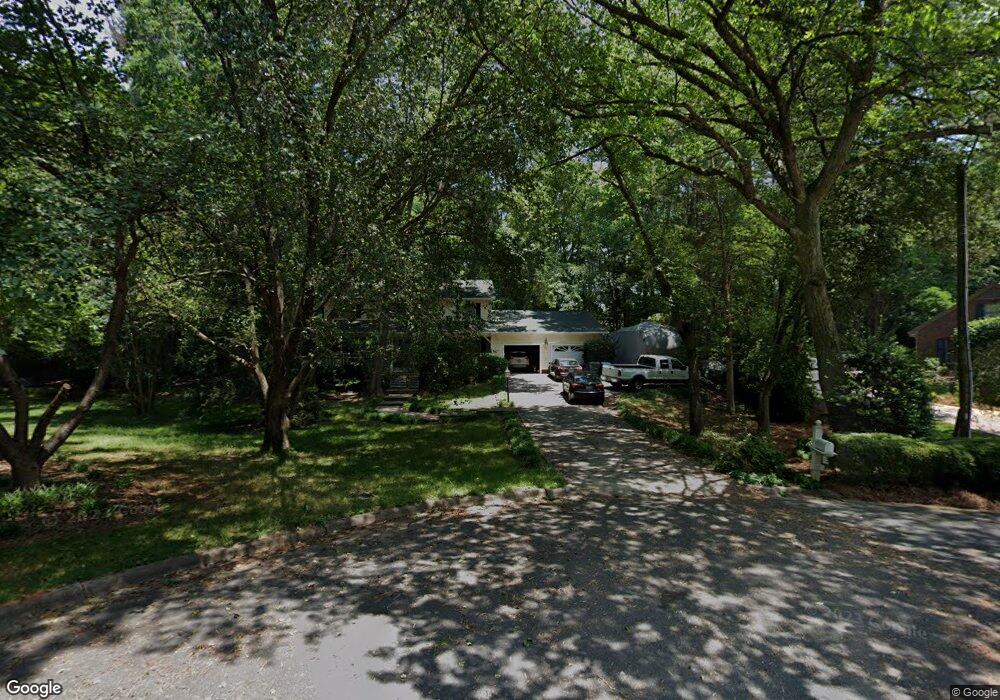
112 Buckingham Place Salisbury, NC 28144
Estimated Value: $373,339 - $494,000
--
Bed
3
Baths
2,524
Sq Ft
$172/Sq Ft
Est. Value
About This Home
This home is located at 112 Buckingham Place, Salisbury, NC 28144 and is currently estimated at $434,835, approximately $172 per square foot. 112 Buckingham Place is a home located in Rowan County with nearby schools including Carroll T Overton Elementary School, Knox Middle School, and North Rowan Middle School.
Ownership History
Date
Name
Owned For
Owner Type
Purchase Details
Closed on
Aug 10, 2006
Sold by
Woods Teena M and Mincello John F
Bought by
Woods Teena M
Current Estimated Value
Purchase Details
Closed on
May 19, 2005
Sold by
Painter Michael D and Painter Denise P
Bought by
Cendant Mobility Financial Corp
Home Financials for this Owner
Home Financials are based on the most recent Mortgage that was taken out on this home.
Original Mortgage
$121,900
Interest Rate
5.54%
Mortgage Type
Fannie Mae Freddie Mac
Purchase Details
Closed on
Apr 20, 2005
Sold by
Cendant Mobility Financial Corp
Bought by
Mincello John F and Woods Teena M
Home Financials for this Owner
Home Financials are based on the most recent Mortgage that was taken out on this home.
Original Mortgage
$121,900
Interest Rate
5.54%
Mortgage Type
Fannie Mae Freddie Mac
Create a Home Valuation Report for This Property
The Home Valuation Report is an in-depth analysis detailing your home's value as well as a comparison with similar homes in the area
Home Values in the Area
Average Home Value in this Area
Purchase History
| Date | Buyer | Sale Price | Title Company |
|---|---|---|---|
| Woods Teena M | -- | Chicago Title Insurance Co | |
| Cendant Mobility Financial Corp | $196,500 | -- | |
| Mincello John F | $188,500 | -- |
Source: Public Records
Mortgage History
| Date | Status | Borrower | Loan Amount |
|---|---|---|---|
| Previous Owner | Mincello John F | $121,900 |
Source: Public Records
Tax History Compared to Growth
Tax History
| Year | Tax Paid | Tax Assessment Tax Assessment Total Assessment is a certain percentage of the fair market value that is determined by local assessors to be the total taxable value of land and additions on the property. | Land | Improvement |
|---|---|---|---|---|
| 2025 | $4,387 | $366,839 | $40,000 | $326,839 |
| 2024 | $4,387 | $366,839 | $40,000 | $326,839 |
| 2023 | $4,387 | $366,839 | $40,000 | $326,839 |
| 2022 | $3,248 | $235,875 | $38,500 | $197,375 |
| 2021 | $3,248 | $235,875 | $38,500 | $197,375 |
| 2020 | $3,248 | $235,875 | $38,500 | $197,375 |
| 2019 | $3,248 | $235,875 | $38,500 | $197,375 |
| 2018 | $2,968 | $218,406 | $38,500 | $179,906 |
| 2017 | $2,952 | $218,406 | $38,500 | $179,906 |
| 2016 | $2,871 | $218,406 | $38,500 | $179,906 |
| 2015 | $2,888 | $218,406 | $38,500 | $179,906 |
| 2014 | $2,926 | $223,858 | $38,500 | $185,358 |
Source: Public Records
Map
Nearby Homes
- 141 Wellington Dr
- 408 Camelot Dr
- 1323 Stork Dr Unit 62A
- 103 Hampshire Ct
- 111 Birkdale Dr
- 209 Rugby Rd
- 301 Rugby Rd
- 117 Yorkshire Dr
- 1129 Morehead Dr
- 305 Rugby Rd
- 1410 Carthage Dr
- 1430 Carthage Dr
- 1095 Morehead Dr
- 1105 Morehead Dr
- 309 Rugby Rd
- 1228 Morehead Dr
- 313 Rugby Rd
- 1470 Carthage Dr
- 1480 Carthage Dr
- 1304 Overhill Rd
- 116 Buckingham Place
- 609 Camelot Dr
- 108 Buckingham Place
- 1920 Old Mocksville Rd
- 104 Buckingham Place
- 605 Camelot Dr
- 2006 Old Mocksville Rd
- 616 Camelot Dr
- 616 Camelot Dr Unit 82
- 108 Wellington Dr
- 104 Wellington Dr
- 112 Wellington Dr
- 112 Dandridge Place
- 100 Wellington Dr
- 116 Wellington Dr
- 608 Camelot Dr
- 2012 Old Mocksville Rd
- 120 Wellington Dr
- 108 Dandridge Place
- 604 Camelot Dr