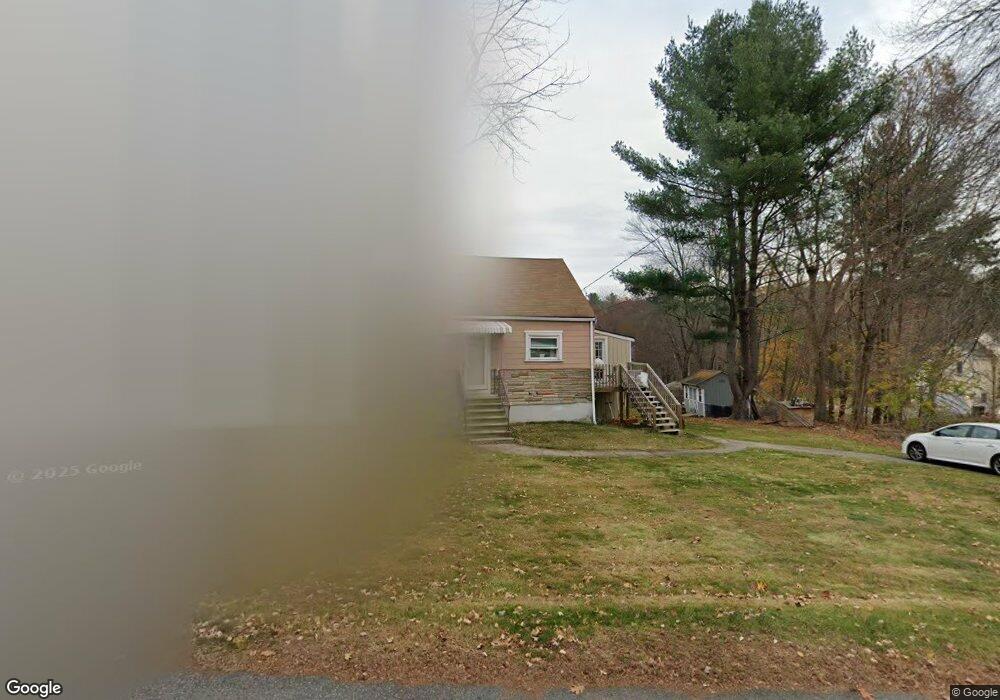
112 Causeway St Hudson, MA 01749
Estimated Value: $414,000 - $571,000
2
Beds
2
Baths
1,229
Sq Ft
$415/Sq Ft
Est. Value
About This Home
This home is located at 112 Causeway St, Hudson, MA 01749 and is currently estimated at $510,035, approximately $415 per square foot. 112 Causeway St is a home located in Middlesex County with nearby schools including David J. Quinn Middle School, Hudson High School, and First Steps Children's Center.
Ownership History
Date
Name
Owned For
Owner Type
Purchase Details
Closed on
May 12, 2009
Sold by
Mendoza-Noyola Guadalupe
Bought by
Noyola Oliverio
Current Estimated Value
Purchase Details
Closed on
Mar 28, 2000
Sold by
Martel Lisa
Bought by
Noyola Oliverio and Noyola Maria G
Purchase Details
Closed on
Jan 31, 1992
Sold by
Blood Eileen A
Bought by
Martel Steven L and Martel Lisa
Create a Home Valuation Report for This Property
The Home Valuation Report is an in-depth analysis detailing your home's value as well as a comparison with similar homes in the area
Home Values in the Area
Average Home Value in this Area
Purchase History
| Date | Buyer | Sale Price | Title Company |
|---|---|---|---|
| Noyola Oliverio | -- | -- | |
| Noyola Oliverio | -- | -- | |
| Noyola Oliverio | $169,000 | -- | |
| Martel Steven L | $119,000 | -- |
Source: Public Records
Mortgage History
| Date | Status | Borrower | Loan Amount |
|---|---|---|---|
| Open | Martel Steven L | $12,500 | |
| Closed | Martel Steven L | $12,000 | |
| Open | Martel Steven L | $188,500 |
Source: Public Records
Tax History Compared to Growth
Tax History
| Year | Tax Paid | Tax Assessment Tax Assessment Total Assessment is a certain percentage of the fair market value that is determined by local assessors to be the total taxable value of land and additions on the property. | Land | Improvement |
|---|---|---|---|---|
| 2025 | $6,118 | $440,800 | $161,700 | $279,100 |
| 2024 | $5,853 | $418,100 | $147,000 | $271,100 |
| 2023 | $5,437 | $372,400 | $141,300 | $231,100 |
| 2022 | $4,877 | $307,500 | $128,400 | $179,100 |
| 2021 | $7,063 | $291,000 | $122,400 | $168,600 |
| 2020 | $4,564 | $274,800 | $119,900 | $154,900 |
| 2019 | $6,620 | $253,500 | $119,900 | $133,600 |
| 2018 | $4,169 | $238,200 | $114,200 | $124,000 |
| 2017 | $3,889 | $222,200 | $108,800 | $113,400 |
| 2016 | $3,640 | $210,500 | $108,800 | $101,700 |
| 2015 | $3,413 | $197,600 | $108,800 | $88,800 |
| 2014 | $3,292 | $189,000 | $95,400 | $93,600 |
Source: Public Records
Map
Nearby Homes
- 9 & 9A Abigail
- 16 Abigail Dr
- 18 Collins Dr
- 502 Hosmer St
- 33A Russo Dr
- 68 Upland Rd
- 7 Old North Rd
- 24 Seneca Dr
- 7e Strawberry Ln Unit E
- 20 Beauregard Cir
- 114 Lodi Rd
- 46 Jewell Rd Unit Lot 5
- 44 Jewell Rd Unit Lot 4
- 30 Jewell Rd Unit Lot 2
- 492 Stow Rd
- 25 Knight Way
- 397 Stow Rd
- 38 Airport Blvd
- 256 Robert Rd
- 425 Main St Unit 11B
- 110 Causeway St
- 110 Causeway St Unit 1
- 114 Causeway St
- 108 Causeway St
- 60 Lakeshore Dr
- 115 Causeway St
- 7 Lower Rd
- 109 Causeway St
- 9 Lower Rd
- 11 Lower Rd
- 117 Causeway St
- 116 Causeway St
- 107 Causeway St
- 58 Lakeshore Dr
- 106 Causeway St
- 119 Causeway St
- 105 Causeway St
- 5 Lower Rd
- 56 Lakeshore Dr
- 121 Causeway St