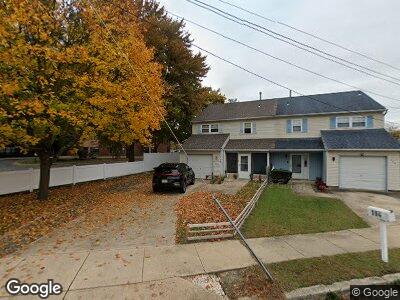
112 Chestnut St Williamstown, NJ 08094
Estimated Value: $239,000 - $330,000
--
Bed
--
Bath
1,428
Sq Ft
$192/Sq Ft
Est. Value
About This Home
This home is located at 112 Chestnut St, Williamstown, NJ 08094 and is currently estimated at $274,346, approximately $192 per square foot. 112 Chestnut St is a home located in Gloucester County with nearby schools including Williamstown High School, St. Mary School, and Finest of the Wheat Christian.
Ownership History
Date
Name
Owned For
Owner Type
Purchase Details
Closed on
Aug 3, 1999
Sold by
Federal National Mortgage Association
Bought by
Hadry Michael J and Hadry Kathy Lynn
Current Estimated Value
Home Financials for this Owner
Home Financials are based on the most recent Mortgage that was taken out on this home.
Original Mortgage
$61,462
Outstanding Balance
$20,253
Interest Rate
7.5%
Mortgage Type
FHA
Estimated Equity
$261,800
Purchase Details
Closed on
Mar 19, 1999
Sold by
Shannon Stanley M and Shannon Donna L
Bought by
Federal National Mortgage Association
Purchase Details
Closed on
Feb 28, 1994
Sold by
Pantisano Frank
Bought by
Shannon Stanley M and Shannon Donna
Home Financials for this Owner
Home Financials are based on the most recent Mortgage that was taken out on this home.
Original Mortgage
$77,000
Interest Rate
7.01%
Create a Home Valuation Report for This Property
The Home Valuation Report is an in-depth analysis detailing your home's value as well as a comparison with similar homes in the area
Home Values in the Area
Average Home Value in this Area
Purchase History
| Date | Buyer | Sale Price | Title Company |
|---|---|---|---|
| Hadry Michael J | $61,500 | -- | |
| Federal National Mortgage Association | -- | -- | |
| Shannon Stanley M | $81,400 | -- |
Source: Public Records
Mortgage History
| Date | Status | Borrower | Loan Amount |
|---|---|---|---|
| Open | Hadry Michael J | $3,078 | |
| Open | Hadry Kathy Lynn | $16,359 | |
| Open | Hadry Michael J | $61,462 | |
| Previous Owner | Shannon Stanley M | $77,000 |
Source: Public Records
Tax History Compared to Growth
Tax History
| Year | Tax Paid | Tax Assessment Tax Assessment Total Assessment is a certain percentage of the fair market value that is determined by local assessors to be the total taxable value of land and additions on the property. | Land | Improvement |
|---|---|---|---|---|
| 2024 | $4,835 | $133,000 | $37,900 | $95,100 |
| 2023 | $4,835 | $133,000 | $37,900 | $95,100 |
| 2022 | $4,843 | $133,000 | $37,900 | $95,100 |
| 2021 | $4,843 | $133,000 | $37,900 | $95,100 |
| 2020 | $4,837 | $133,000 | $37,900 | $95,100 |
| 2019 | $4,808 | $133,000 | $37,900 | $95,100 |
| 2018 | $4,729 | $133,000 | $37,900 | $95,100 |
| 2017 | $5,391 | $152,200 | $35,900 | $116,300 |
| 2016 | $6,676 | $190,900 | $35,900 | $155,000 |
| 2015 | $6,485 | $190,900 | $35,900 | $155,000 |
| 2014 | $6,296 | $190,900 | $35,900 | $155,000 |
Source: Public Records
Map
Nearby Homes
- 445 Blue Bell Rd
- 232 Chestnut St
- 221 Oak St
- 600 S Main St
- 354 S Main St
- 444 Madison Ave
- 207 Church St
- 804 Rosetree Dr
- 109 Poplar St
- 20 Maple Ave
- 920 Hampton Way
- 33 Miracle Dr
- 872 Black Horse Pike
- 712 Brandywine Dr Unit A1
- L. 5 N Black Horse Pike
- 63 Gordon Ave
- 618 Stockton Dr
- 325 Gordon Ave
- 418 N Main St
- 310 Bryn Mawr Dr
- 112 Chestnut St
- 114 Chestnut St
- 510 Blue Bell Rd
- 512 Blue Bell Rd
- 440 Blue Bell Rd
- 402 Blue Bell Rd Unit A
- 402 Blue Bell Rd Unit B
- 402 Blue Bell Rd
- 433 Blue Bell Rd Unit 435
- 439 Blue Bell Rd
- 438 Blue Bell Rd
- 208 Chestnut St
- 428 Blue Bell Rd Unit 430
- 101 Chestnut St
- 427 Blue Bell Rd Unit 429
- 420 Blue Bell Rd
- 213 Chestnut St
- 418 Blue Bell Rd
- 419 Blue Bell Rd
- 220 Chestnut St