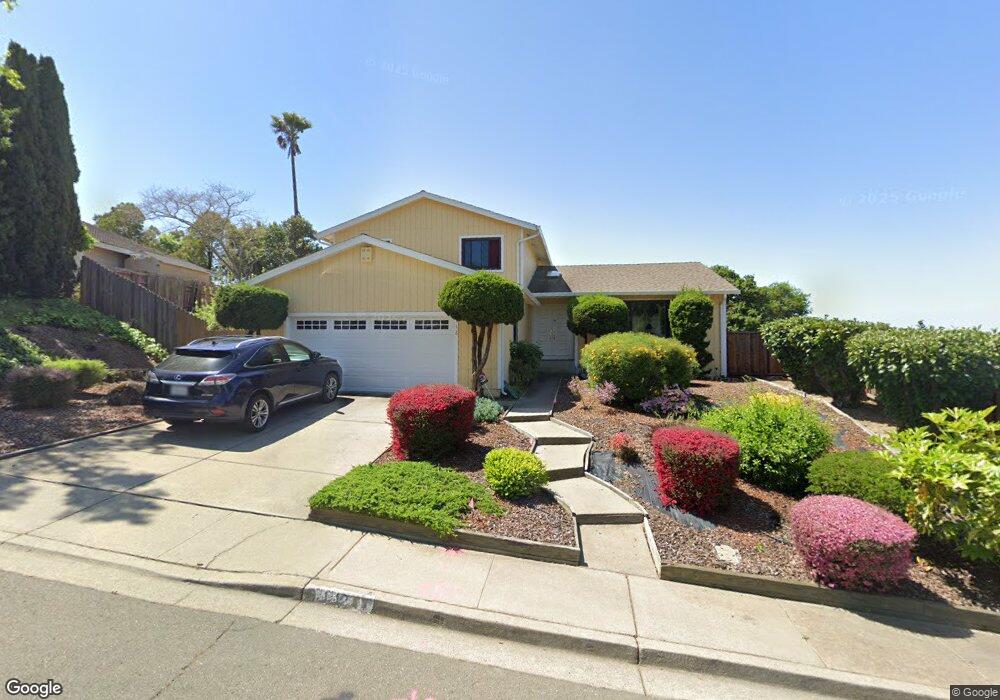
112 Chinquapin Ct Hercules, CA 94547
Estimated Value: $883,000 - $1,016,000
4
Beds
3
Baths
2,409
Sq Ft
$390/Sq Ft
Est. Value
About This Home
This home is located at 112 Chinquapin Ct, Hercules, CA 94547 and is currently estimated at $940,096, approximately $390 per square foot. 112 Chinquapin Ct is a home located in Contra Costa County with nearby schools including Lupine Hills Elementary School, Hercules Middle School, and Hercules High School.
Ownership History
Date
Name
Owned For
Owner Type
Purchase Details
Closed on
Nov 18, 1999
Sold by
Thompson Donald W and Thompson Hattie M
Bought by
Oliver Marcel E and Oliver Cynthia T
Current Estimated Value
Home Financials for this Owner
Home Financials are based on the most recent Mortgage that was taken out on this home.
Original Mortgage
$212,000
Outstanding Balance
$65,711
Interest Rate
7.95%
Mortgage Type
Purchase Money Mortgage
Estimated Equity
$874,385
Create a Home Valuation Report for This Property
The Home Valuation Report is an in-depth analysis detailing your home's value as well as a comparison with similar homes in the area
Home Values in the Area
Average Home Value in this Area
Purchase History
| Date | Buyer | Sale Price | Title Company |
|---|---|---|---|
| Oliver Marcel E | $265,000 | Financial Title Company |
Source: Public Records
Mortgage History
| Date | Status | Borrower | Loan Amount |
|---|---|---|---|
| Open | Oliver Marcel E | $212,000 | |
| Closed | Oliver Marcel E | $26,500 |
Source: Public Records
Tax History Compared to Growth
Tax History
| Year | Tax Paid | Tax Assessment Tax Assessment Total Assessment is a certain percentage of the fair market value that is determined by local assessors to be the total taxable value of land and additions on the property. | Land | Improvement |
|---|---|---|---|---|
| 2025 | $6,650 | $407,270 | $135,241 | $272,029 |
| 2024 | $6,541 | $399,286 | $132,590 | $266,696 |
| 2023 | $6,541 | $391,458 | $129,991 | $261,467 |
| 2022 | $6,227 | $383,784 | $127,443 | $256,341 |
| 2021 | $6,455 | $376,260 | $124,945 | $251,315 |
| 2019 | $6,138 | $365,102 | $121,240 | $243,862 |
| 2018 | $5,966 | $357,944 | $118,863 | $239,081 |
| 2017 | $5,878 | $350,927 | $116,533 | $234,394 |
| 2016 | $5,717 | $344,048 | $114,249 | $229,799 |
| 2015 | $5,725 | $338,881 | $112,533 | $226,348 |
| 2014 | $5,710 | $332,244 | $110,329 | $221,915 |
Source: Public Records
Map
Nearby Homes
- 199 Shepard St
- 103 Columbine Dr
- 115 Nutmeg Ct
- 416 Lighthouse Ct Unit 416
- 256 Napoli Ct Unit 256
- 273 Florence Ct
- 1769 Redwood Rd
- 400 Grenadine Way
- 118 Sparrow Dr
- 328 Grenadine Way
- 139 Thrush Ct
- 9 Moraine Ct
- 524 Rosewood Ln
- 748 Windward Dr
- 720 Seacliff Ct
- 112 Robin Ct
- 2632 Wright Ave
- 2700 Carmen Ct
- 4012 Marcas St
- 405 Weymouth
- 118 Chinquapin Ct
- 2285 Lupine Rd
- 2291 Lupine Rd
- 2295 Redwood Rd
- 2301 Redwood Rd
- 124 Chinquapin Ct
- 109 Chinquapin Ct
- 2289 Redwood Rd
- 115 Chinquapin Ct
- 103 Chinquapin Ct
- 2283 Redwood Rd
- 130 Chinquapin Ct
- 121 Chinquapin Ct
- 2307 Redwood Rd
- 2269 Lupine Rd
- 2282 Lupine Rd
- 127 Chinquapin Ct
- 136 Chinquapin Ct
- 2313 Redwood Rd
- 2288 Lupine Rd