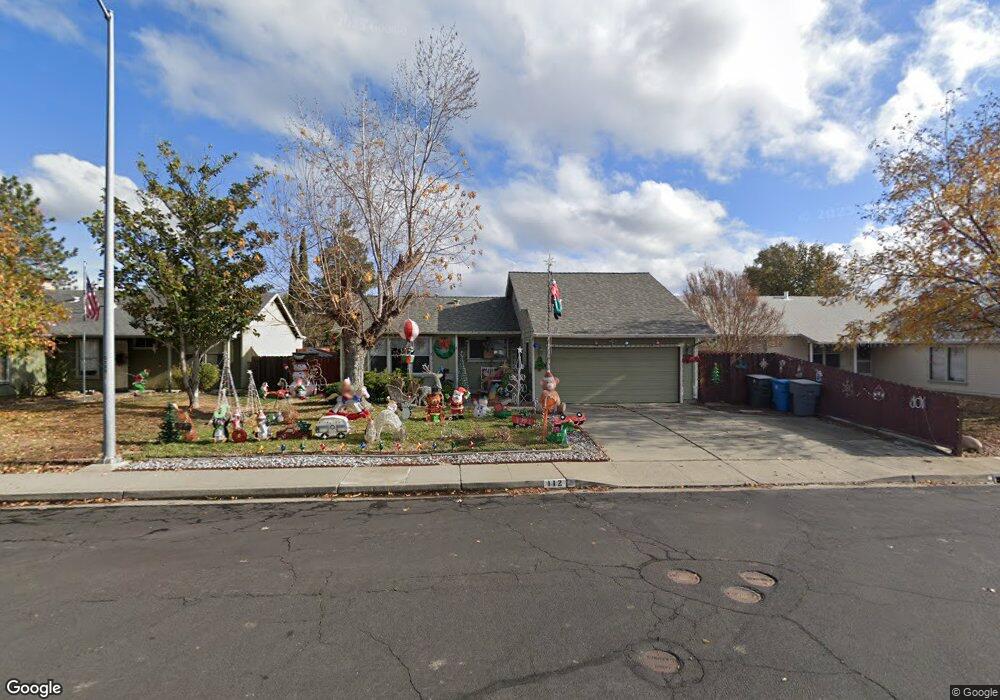
112 Columbia Dr Vacaville, CA 95687
Estimated Value: $499,434 - $578,000
3
Beds
2
Baths
1,324
Sq Ft
$411/Sq Ft
Est. Value
About This Home
This home is located at 112 Columbia Dr, Vacaville, CA 95687 and is currently estimated at $543,609, approximately $410 per square foot. 112 Columbia Dr is a home located in Solano County with nearby schools including Jean Callison Elementary School, Orchard Elementary School, and Vaca Pena Middle School.
Ownership History
Date
Name
Owned For
Owner Type
Purchase Details
Closed on
Mar 27, 2000
Sold by
Winings Helen D
Bought by
Leonard Danny M and Leonard Allison M
Current Estimated Value
Home Financials for this Owner
Home Financials are based on the most recent Mortgage that was taken out on this home.
Original Mortgage
$159,433
Outstanding Balance
$54,896
Interest Rate
8.3%
Mortgage Type
FHA
Estimated Equity
$488,713
Purchase Details
Closed on
May 30, 1998
Sold by
Wood William W and Winings Helen D
Bought by
Winings Henlen D
Purchase Details
Closed on
May 13, 1996
Sold by
Serapio Roberto O and Serapio Mary E
Bought by
Wood William W and Winings Helen D
Home Financials for this Owner
Home Financials are based on the most recent Mortgage that was taken out on this home.
Original Mortgage
$74,900
Interest Rate
7.8%
Create a Home Valuation Report for This Property
The Home Valuation Report is an in-depth analysis detailing your home's value as well as a comparison with similar homes in the area
Home Values in the Area
Average Home Value in this Area
Purchase History
| Date | Buyer | Sale Price | Title Company |
|---|---|---|---|
| Leonard Danny M | $160,500 | Frontier Title Company | |
| Winings Henlen D | -- | -- | |
| Wood William W | $124,500 | -- |
Source: Public Records
Mortgage History
| Date | Status | Borrower | Loan Amount |
|---|---|---|---|
| Open | Leonard Danny M | $159,433 | |
| Previous Owner | Wood William W | $74,900 |
Source: Public Records
Tax History Compared to Growth
Tax History
| Year | Tax Paid | Tax Assessment Tax Assessment Total Assessment is a certain percentage of the fair market value that is determined by local assessors to be the total taxable value of land and additions on the property. | Land | Improvement |
|---|---|---|---|---|
| 2025 | $2,931 | $246,675 | $61,476 | $185,199 |
| 2024 | $2,931 | $241,839 | $60,271 | $181,568 |
| 2023 | $2,859 | $237,098 | $59,090 | $178,008 |
| 2022 | $2,787 | $232,450 | $57,932 | $174,518 |
| 2021 | $3,285 | $227,894 | $56,797 | $171,097 |
| 2020 | $3,225 | $225,558 | $56,215 | $169,343 |
| 2019 | $3,159 | $221,136 | $55,113 | $166,023 |
| 2018 | $3,097 | $216,801 | $54,033 | $162,768 |
| 2017 | $2,880 | $212,551 | $52,974 | $159,577 |
| 2016 | $2,559 | $208,385 | $51,936 | $156,449 |
| 2015 | $2,527 | $205,255 | $51,156 | $154,099 |
| 2014 | $2,372 | $201,235 | $50,154 | $151,081 |
Source: Public Records
Map
Nearby Homes
- 1055 Notre Dame Cir
- 420 Temple Dr
- 154 Edwin Dr
- 137 Edwin Dr
- 725 Wellsey Rd
- 654 Rutgers St
- 512 Oakmeadow Ct
- 725 Arabian Cir
- 148 Randall Ave
- 642 White Oak Ln
- 755 Oak Hollow Ave
- 488 Edwin Dr
- 142 Nantucket Cir
- 431 Stanford St
- 309 Regency Cir
- 190 Huntington Dr
- 1801 Marshall Rd Unit 408
- 1801 Marshall Rd Unit 908
- 507 Topeka Ln
- 313 Toyon Ln