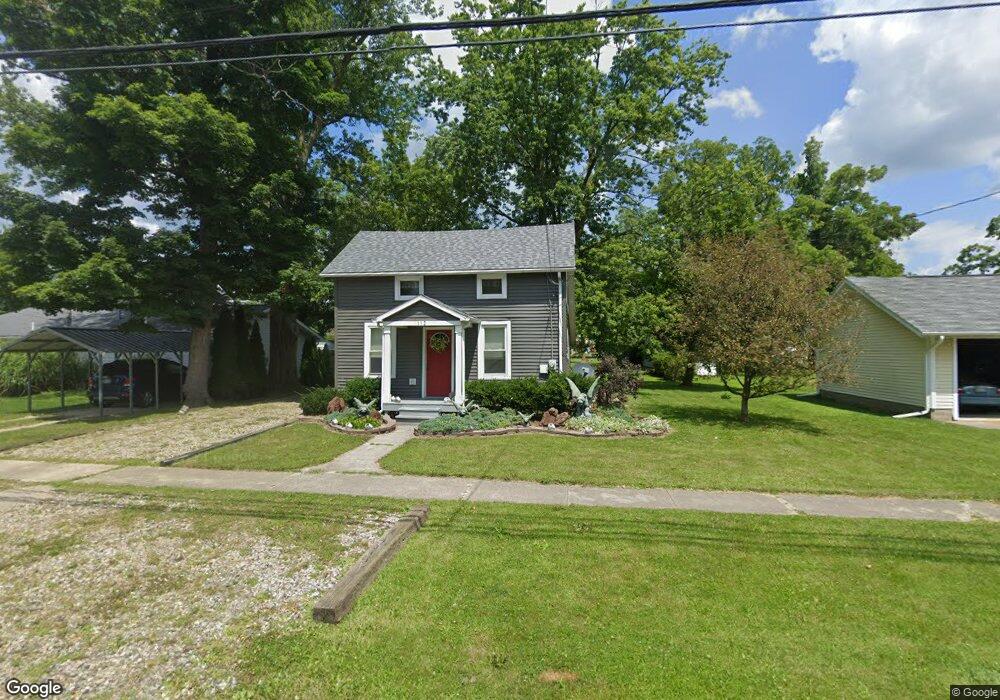
112 E Elm St Reading, MI 49274
Estimated Value: $104,000 - $139,157
2
Beds
1
Bath
660
Sq Ft
$195/Sq Ft
Est. Value
About This Home
This home is located at 112 E Elm St, Reading, MI 49274 and is currently estimated at $128,539, approximately $194 per square foot. 112 E Elm St is a home located in Hillsdale County with nearby schools including Reynolds Elementary School, Reading High School, and Cooper Amish School.
Ownership History
Date
Name
Owned For
Owner Type
Purchase Details
Closed on
Sep 26, 2008
Sold by
Allen Gwen B
Bought by
Allen Gwen B and Guise Gail Ann
Current Estimated Value
Home Financials for this Owner
Home Financials are based on the most recent Mortgage that was taken out on this home.
Original Mortgage
$36,000
Interest Rate
6.57%
Mortgage Type
Purchase Money Mortgage
Purchase Details
Closed on
Jan 6, 2006
Sold by
Siers Aletta M and Siers Wesley G
Bought by
Citifinancial Mortgage Co Inc
Purchase Details
Closed on
Oct 21, 2005
Sold by
Siers Aletta M and Siers Wesley G
Bought by
Citifinancial Mortgage Co Inc
Purchase Details
Closed on
Sep 30, 1997
Sold by
Sanders Randy W and Sanders Deborah K
Bought by
Siers Wesley G and Siers Aletta M
Purchase Details
Closed on
Dec 29, 1995
Sold by
Rosenberry William D and Rosenberry Pamela
Bought by
Sanders Randy W and Sanders Deborah K
Create a Home Valuation Report for This Property
The Home Valuation Report is an in-depth analysis detailing your home's value as well as a comparison with similar homes in the area
Purchase History
| Date | Buyer | Sale Price | Title Company |
|---|---|---|---|
| Allen Gwen B | -- | First American Title Ins | |
| Allen Gwen B | $58,000 | First American Title Ins | |
| Citifinancial Mortgage Co Inc | $17,500 | None Available | |
| Citifinancial Mortgage Co Inc | $54,904 | -- | |
| Siers Wesley G | $30,000 | -- | |
| Sanders Randy W | $20,000 | -- |
Source: Public Records
Mortgage History
| Date | Status | Borrower | Loan Amount |
|---|---|---|---|
| Closed | Allen Gwen B | $36,000 |
Source: Public Records
Tax History
| Year | Tax Paid | Tax Assessment Tax Assessment Total Assessment is a certain percentage of the fair market value that is determined by local assessors to be the total taxable value of land and additions on the property. | Land | Improvement |
|---|---|---|---|---|
| 2025 | $522 | $42,600 | $0 | $0 |
| 2024 | $5 | $41,300 | $0 | $0 |
| 2023 | $487 | $31,400 | $0 | $0 |
| 2022 | $744 | $26,100 | $0 | $0 |
| 2021 | $723 | $24,900 | $0 | $0 |
| 2020 | $717 | $22,100 | $0 | $0 |
| 2019 | $694 | $21,700 | $0 | $0 |
| 2018 | $667 | $22,500 | $0 | $0 |
| 2017 | $647 | $21,600 | $0 | $0 |
| 2016 | $641 | $21,200 | $0 | $0 |
| 2015 | $411 | $21,200 | $0 | $0 |
| 2013 | $398 | $16,940 | $0 | $0 |
| 2012 | $405 | $17,260 | $0 | $0 |
Source: Public Records
Map
Nearby Homes
- 309 S Main St
- 108 Lynn St
- 0 W Silver St Unit 25044322
- 226 Strong St
- 0 Long Lake Rd Unit 26458115
- 0 Long Lake Rd Unit 26009910
- 4380 Abbott Rd
- 5211 Long Lake Rd
- 5339 Lake Dr
- 7944 Gilmore Rd
- 5482 Circle Dr
- 5100 Long Lake Rd
- 5375 Paradise Dr
- 4427 Carpenter Rd
- 3870 Rus Dic Dr
- 7535 Popple Ln
- 9949 Indian Trail
- 7841 Topinabee Dr
- 0 Dimmers Rd
- 4111 Blair Rd
Your Personal Tour Guide
Ask me questions while you tour the home.