Estimated Value: $254,475 - $292,000
4
Beds
2
Baths
1,696
Sq Ft
$157/Sq Ft
Est. Value
About This Home
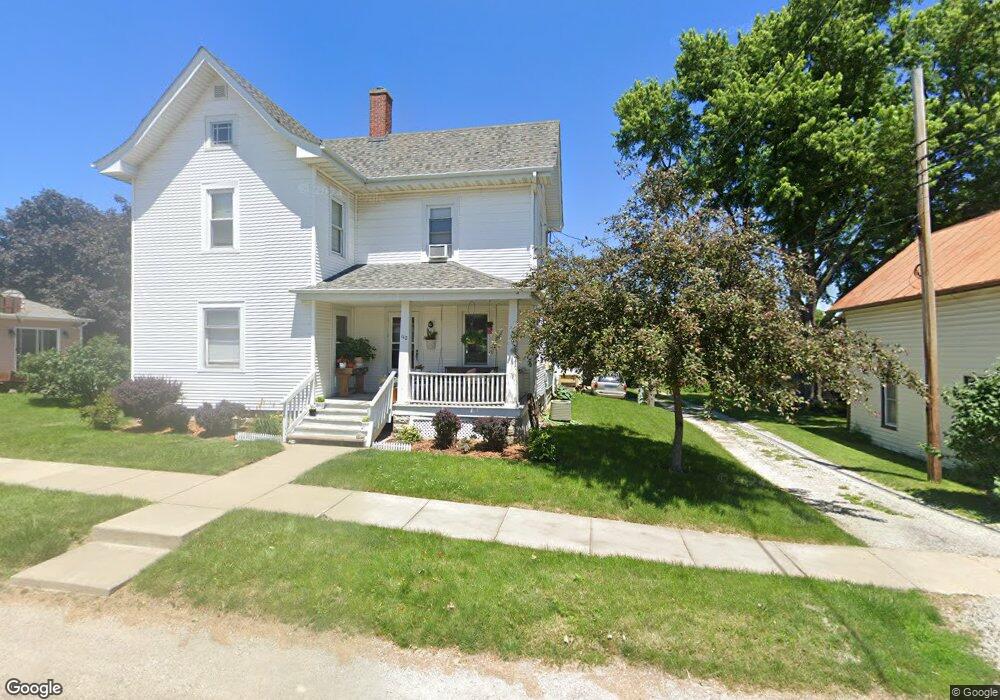
This home is located at 112 E North St, Solon, IA 52333 and is currently estimated at $266,619, approximately $157 per square foot. 112 E North St is a home located in Johnson County with nearby schools including Lakeview Elementary School, Solon Middle School, and Solon High School.
Ownership History
Date
Name
Owned For
Owner Type
Purchase Details
Closed on
Oct 6, 2015
Sold by
Radenbaugh Kay C
Bought by
Ruzicka Jeffrey R and Ruzicka Robert R
Current Estimated Value
Home Financials for this Owner
Home Financials are based on the most recent Mortgage that was taken out on this home.
Original Mortgage
$124,800
Outstanding Balance
$98,022
Interest Rate
3.91%
Mortgage Type
Future Advance Clause Open End Mortgage
Estimated Equity
$168,597
Create a Home Valuation Report for This Property
The Home Valuation Report is an in-depth analysis detailing your home's value as well as a comparison with similar homes in the area
Home Values in the Area
Average Home Value in this Area
Purchase History
| Date | Buyer | Sale Price | Title Company |
|---|---|---|---|
| Ruzicka Jeffrey R | $260 | None Available |
Source: Public Records
Mortgage History
| Date | Status | Borrower | Loan Amount |
|---|---|---|---|
| Open | Ruzicka Jeffrey R | $124,800 |
Source: Public Records
Tax History
| Year | Tax Paid | Tax Assessment Tax Assessment Total Assessment is a certain percentage of the fair market value that is determined by local assessors to be the total taxable value of land and additions on the property. | Land | Improvement |
|---|---|---|---|---|
| 2025 | $3,244 | $229,800 | $41,400 | $188,400 |
| 2024 | $32 | $191,500 | $41,400 | $150,100 |
| 2023 | $3,472 | $191,500 | $41,400 | $150,100 |
| 2022 | $3,432 | $181,200 | $35,900 | $145,300 |
| 2021 | $3,416 | $181,200 | $35,900 | $145,300 |
| 2020 | $3,416 | $172,900 | $27,600 | $145,300 |
| 2019 | $3,180 | $172,900 | $27,600 | $145,300 |
| 2018 | $3,118 | $159,000 | $27,600 | $131,400 |
| 2017 | $3,118 | $159,000 | $27,600 | $131,400 |
| 2016 | $2,556 | $147,300 | $27,600 | $119,700 |
| 2015 | $2,556 | $139,400 | $27,600 | $111,800 |
| 2014 | $2,376 | $129,200 | $27,600 | $101,600 |
Source: Public Records
Map
Nearby Homes
- 1570 Volmert Ln NE
- 400 E Main St Unit 6
- 400 E Main St Unit 5
- 400 E Main St Unit 4
- 400 E Main St Unit 3
- 230 S Dubuque St
- 403 E Main St
- 405 E Main St
- 407 E Main St
- 411 Macbride Trail
- 131 W 3rd St
- 508 S Market St
- 600 Majestic Oak Ridge
- 707 Cedar Bend Dr
- 704 Cedar Bend Dr
- 715 Cedar Bend Dr
- 730 S Market St Unit 12
- 730 S Market St
- 900 Crestview Dr
- 808 Crestview Dr
Your Personal Tour Guide
Ask me questions while you tour the home.