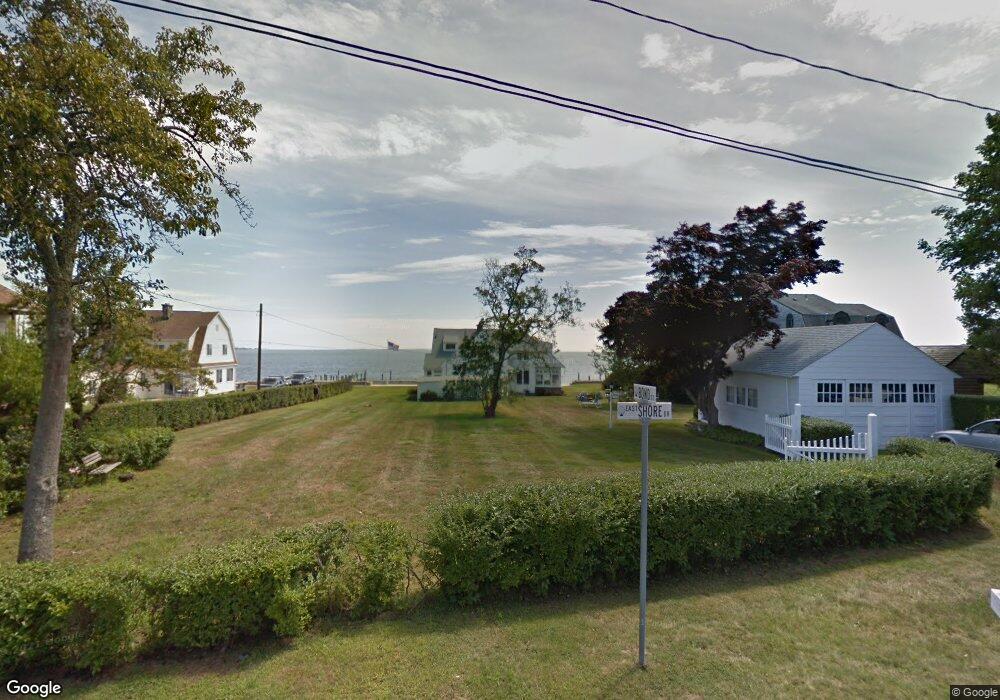
112 E Shore Dr Niantic, CT 06357
Estimated Value: $1,001,768 - $1,488,000
4
Beds
2
Baths
1,839
Sq Ft
$643/Sq Ft
Est. Value
About This Home
This home is located at 112 E Shore Dr, Niantic, CT 06357 and is currently estimated at $1,181,589, approximately $642 per square foot. 112 E Shore Dr is a home located in New London County with nearby schools including East Lyme Middle School, East Lyme High School, and The Light House Voc-Ed Center.
Ownership History
Date
Name
Owned For
Owner Type
Purchase Details
Closed on
Sep 19, 2020
Sold by
Joan Sullivan T
Bought by
Martin Robert
Current Estimated Value
Purchase Details
Closed on
Jul 29, 2020
Sold by
Martin Mary A
Bought by
Martin Maryanne and Martin Robert
Purchase Details
Closed on
Jun 20, 2012
Sold by
Sullivan Joan F
Bought by
Joan F Sullivan T
Home Financials for this Owner
Home Financials are based on the most recent Mortgage that was taken out on this home.
Original Mortgage
$350,000
Interest Rate
3.67%
Create a Home Valuation Report for This Property
The Home Valuation Report is an in-depth analysis detailing your home's value as well as a comparison with similar homes in the area
Home Values in the Area
Average Home Value in this Area
Purchase History
| Date | Buyer | Sale Price | Title Company |
|---|---|---|---|
| Martin Robert | -- | None Available | |
| Martin Robert | -- | None Available | |
| Martin Maryanne | -- | None Available | |
| Martin Maryanne | -- | None Available | |
| Joan F Sullivan T | -- | -- | |
| Joan F Sullivan T F | -- | -- |
Source: Public Records
Mortgage History
| Date | Status | Borrower | Loan Amount |
|---|---|---|---|
| Previous Owner | Joan F Sullivan T F | $350,000 | |
| Previous Owner | Joan F Sullivan T F | $350,000 | |
| Previous Owner | Joan F Sullivan T F | $300,000 |
Source: Public Records
Tax History
| Year | Tax Paid | Tax Assessment Tax Assessment Total Assessment is a certain percentage of the fair market value that is determined by local assessors to be the total taxable value of land and additions on the property. | Land | Improvement |
|---|---|---|---|---|
| 2025 | $18,709 | $667,940 | $493,920 | $174,020 |
| 2024 | $16,680 | $633,010 | $493,920 | $139,090 |
| 2023 | $15,615 | $627,620 | $493,920 | $133,700 |
| 2022 | $14,962 | $627,620 | $493,920 | $133,700 |
| 2021 | $14,936 | $523,880 | $428,050 | $95,830 |
| 2020 | $14,857 | $523,880 | $428,050 | $95,830 |
| 2019 | $14,768 | $523,880 | $428,050 | $95,830 |
| 2018 | $14,328 | $523,880 | $428,050 | $95,830 |
| 2017 | $13,705 | $523,880 | $428,050 | $95,830 |
| 2016 | $13,126 | $517,580 | $428,050 | $89,530 |
| 2015 | $12,789 | $517,580 | $428,050 | $89,530 |
| 2014 | $12,437 | $517,580 | $428,050 | $89,530 |
Source: Public Records
Map
Nearby Homes
- 15 Osprey Rd
- 61 Whitecap Rd
- 36 Attawan Rd
- 26 Mohawk Dr
- 15 Griswold Rd
- 127 Black Point Rd Unit 7
- 42 S Washington Ave
- 16 Laurelwood Dr
- 68-70 Black Point Rd
- 19 Sapia Dr
- 9 Columbus Ave
- 468 Main St Unit 318
- 468 Main St Unit 111
- 31 Regatta Dr
- 18 Compass Ct
- 43 Village Crossing Unit 43
- 47 Village Crossing Unit 47
- 46 Village Crossing Unit 46
- 185 Main St Unit 301
- 185 Main St Unit 305
Your Personal Tour Guide
Ask me questions while you tour the home.