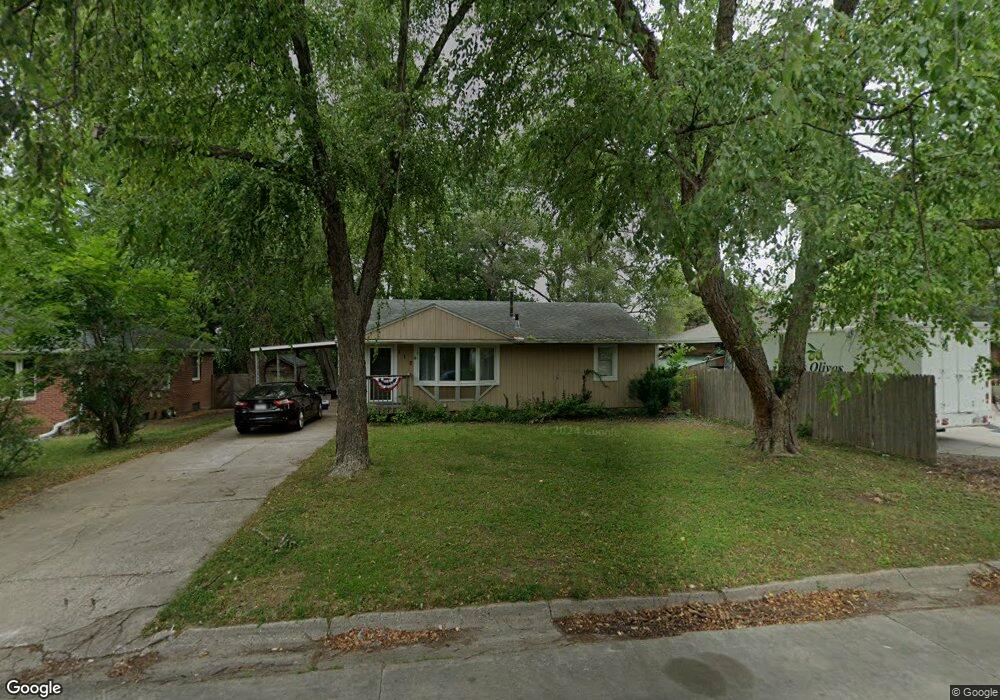
112 E Thornton Ave Des Moines, IA 50315
Indianola Hills NeighborhoodEstimated Value: $132,000 - $179,000
3
Beds
1
Bath
1,000
Sq Ft
$153/Sq Ft
Est. Value
About This Home
This home is located at 112 E Thornton Ave, Des Moines, IA 50315 and is currently estimated at $153,298, approximately $153 per square foot. 112 E Thornton Ave is a home located in Polk County with nearby schools including South Union Elementary School, Weeks Middle School, and Lincoln High School.
Ownership History
Date
Name
Owned For
Owner Type
Purchase Details
Closed on
Jan 30, 2025
Sold by
Stephenson Jason R and Stephenson Kristina
Bought by
Systematic Investment Partners Llc
Current Estimated Value
Purchase Details
Closed on
Oct 24, 2008
Sold by
Tigner Scott and Tigner Michele D
Bought by
Stephenson Jason R and Stephenson Nicolle E
Home Financials for this Owner
Home Financials are based on the most recent Mortgage that was taken out on this home.
Original Mortgage
$112,021
Interest Rate
5.94%
Mortgage Type
FHA
Purchase Details
Closed on
Feb 14, 2003
Sold by
Lacona Bell Lisa R
Bought by
Tigner Scott and Tigner Michele D
Home Financials for this Owner
Home Financials are based on the most recent Mortgage that was taken out on this home.
Original Mortgage
$80,000
Interest Rate
6.06%
Create a Home Valuation Report for This Property
The Home Valuation Report is an in-depth analysis detailing your home's value as well as a comparison with similar homes in the area
Home Values in the Area
Average Home Value in this Area
Purchase History
| Date | Buyer | Sale Price | Title Company |
|---|---|---|---|
| Systematic Investment Partners Llc | $130,000 | None Listed On Document | |
| Systematic Investment Partners Llc | $130,000 | None Listed On Document | |
| Stephenson Jason R | $113,000 | None Available | |
| Tigner Scott | $99,500 | -- |
Source: Public Records
Mortgage History
| Date | Status | Borrower | Loan Amount |
|---|---|---|---|
| Previous Owner | Stephenson Jason R | $112,021 | |
| Previous Owner | Tigner Scott | $80,000 |
Source: Public Records
Tax History Compared to Growth
Tax History
| Year | Tax Paid | Tax Assessment Tax Assessment Total Assessment is a certain percentage of the fair market value that is determined by local assessors to be the total taxable value of land and additions on the property. | Land | Improvement |
|---|---|---|---|---|
| 2025 | $2,788 | $152,200 | $33,100 | $119,100 |
| 2024 | $2,788 | $152,200 | $29,500 | $122,700 |
| 2023 | $2,768 | $152,200 | $29,500 | $122,700 |
| 2022 | $3,799 | $126,300 | $25,100 | $101,200 |
| 2021 | $2,656 | $126,300 | $25,100 | $101,200 |
| 2020 | $2,754 | $115,000 | $22,800 | $92,200 |
| 2019 | $2,582 | $115,000 | $22,800 | $92,200 |
| 2018 | $2,550 | $104,600 | $20,300 | $84,300 |
| 2017 | $2,344 | $104,600 | $20,300 | $84,300 |
| 2016 | $2,278 | $95,200 | $18,200 | $77,000 |
| 2015 | $2,278 | $95,200 | $18,200 | $77,000 |
| 2014 | $2,260 | $97,200 | $18,200 | $79,000 |
Source: Public Records
Map
Nearby Homes
- 3508 Fairlane Dr
- 318 Fleetwood Dr
- 3901 S Union St
- 206 E Hughes Cir
- 119 E Park Ave
- 217 E Park Ave
- 3822 SW 2nd St
- 309 E Park Ave
- 3218 SE 4th Ct
- 300 Hughes Ave
- 32 E Pleasant View Dr
- 348 Pleasant View Dr
- 4316 SE 4th St
- 342 E Pleasant View Dr
- 3215 SW 7th St
- 126 E Maxwelton Dr
- 416 Pleasant View Dr
- 209 E Philip St
- 3308 SW 7th St
- 3111 SE 6th St
- 110 E Thornton Ave
- 116 E Thornton Ave
- 3526 SE 1st Ct
- 3524 SE 1st Ct
- 117 E Thornton Ave
- 109 E Thornton Ave
- 121 E Thornton Ave
- 200 E Thornton Ave
- 36 E Thornton Ave
- 3510 SE 1st Ct
- 3535 SE 1st Ct
- 206 E Thornton Ave
- 30 E Thornton Ave
- 103 E Thornton Ave
- 3529 SE 1st Ct
- 125 E Thornton Ave
- 109 Parmer Dr
- 3523 SE 1st Ct
- 121 Parmer Dr
- 115 Parmer Dr