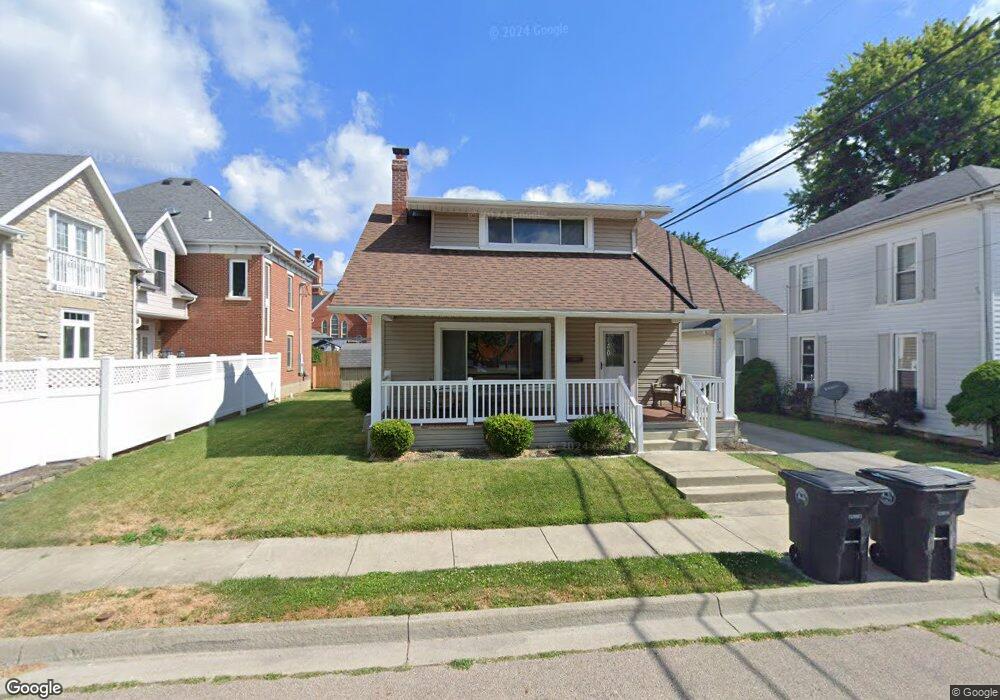
112 E Walnut St Covington, OH 45318
Estimated Value: $147,848 - $184,000
2
Beds
1
Bath
1,123
Sq Ft
$146/Sq Ft
Est. Value
About This Home
This home is located at 112 E Walnut St, Covington, OH 45318 and is currently estimated at $163,712, approximately $145 per square foot. 112 E Walnut St is a home located in Miami County with nearby schools including Covington Elementary/Junior High School, Covington Junior High School, and Covington High School.
Ownership History
Date
Name
Owned For
Owner Type
Purchase Details
Closed on
Dec 3, 1999
Sold by
Sampson Rodney L and Sampson Charlotte A
Bought by
Fitzgerald Robert J
Current Estimated Value
Home Financials for this Owner
Home Financials are based on the most recent Mortgage that was taken out on this home.
Original Mortgage
$76,250
Outstanding Balance
$21,640
Interest Rate
7.97%
Mortgage Type
FHA
Estimated Equity
$142,072
Purchase Details
Closed on
Oct 6, 1989
Bought by
Weaver Charlotte A
Create a Home Valuation Report for This Property
The Home Valuation Report is an in-depth analysis detailing your home's value as well as a comparison with similar homes in the area
Home Values in the Area
Average Home Value in this Area
Purchase History
| Date | Buyer | Sale Price | Title Company |
|---|---|---|---|
| Fitzgerald Robert J | $76,900 | -- | |
| Weaver Charlotte A | $41,900 | -- |
Source: Public Records
Mortgage History
| Date | Status | Borrower | Loan Amount |
|---|---|---|---|
| Open | Fitzgerald Robert J | $76,250 |
Source: Public Records
Tax History
| Year | Tax Paid | Tax Assessment Tax Assessment Total Assessment is a certain percentage of the fair market value that is determined by local assessors to be the total taxable value of land and additions on the property. | Land | Improvement |
|---|---|---|---|---|
| 2025 | $1,449 | $44,390 | $5,710 | $38,680 |
| 2024 | $1,449 | $34,130 | $6,200 | $27,930 |
| 2023 | $1,278 | $34,130 | $6,200 | $27,930 |
| 2022 | $1,275 | $34,130 | $6,200 | $27,930 |
| 2021 | $1,059 | $26,250 | $4,760 | $21,490 |
| 2020 | $1,061 | $26,250 | $4,760 | $21,490 |
| 2019 | $1,066 | $26,250 | $4,760 | $21,490 |
| 2018 | $942 | $23,140 | $3,710 | $19,430 |
| 2017 | $958 | $23,140 | $3,710 | $19,430 |
| 2016 | $946 | $23,140 | $3,710 | $19,430 |
| 2015 | $872 | $22,260 | $3,570 | $18,690 |
| 2014 | $872 | $22,260 | $3,570 | $18,690 |
| 2013 | $840 | $22,260 | $3,570 | $18,690 |
Source: Public Records
Map
Nearby Homes
Your Personal Tour Guide
Ask me questions while you tour the home.