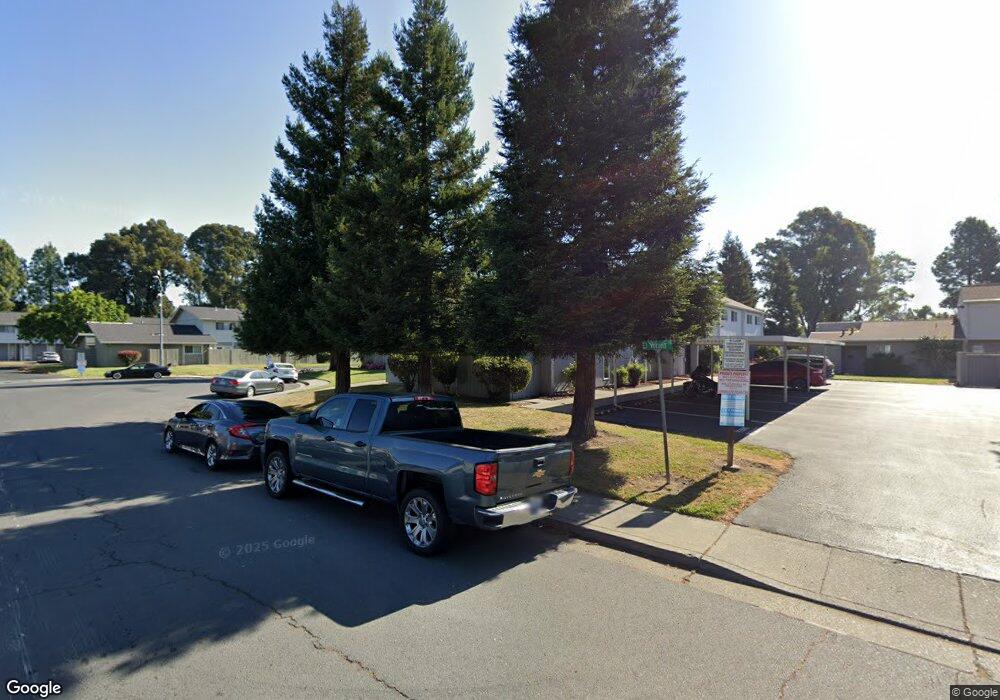
112 El Verano Ct Fairfield, CA 94533
Estimated Value: $223,796 - $267,000
2
Beds
1
Bath
850
Sq Ft
$285/Sq Ft
Est. Value
About This Home
This home is located at 112 El Verano Ct, Fairfield, CA 94533 and is currently estimated at $242,199, approximately $284 per square foot. 112 El Verano Ct is a home located in Solano County with nearby schools including Dover Elementary School, Grange Middle School, and Fairfield High School.
Ownership History
Date
Name
Owned For
Owner Type
Purchase Details
Closed on
Jun 11, 2010
Sold by
Herrera David Anthony and Herrera Lauren
Bought by
Stow Terry Lee
Current Estimated Value
Purchase Details
Closed on
Nov 22, 2005
Sold by
Deckard Daniel L and Deckard Deanna R
Bought by
Herrera David Anthony and Herrera Lauren
Home Financials for this Owner
Home Financials are based on the most recent Mortgage that was taken out on this home.
Original Mortgage
$49,000
Interest Rate
6.14%
Mortgage Type
Stand Alone Second
Purchase Details
Closed on
Aug 2, 2005
Sold by
Huffenberger Julie M
Bought by
Deckard Daniel L and Deckard Deanna R
Home Financials for this Owner
Home Financials are based on the most recent Mortgage that was taken out on this home.
Original Mortgage
$20,000
Interest Rate
5.05%
Mortgage Type
Credit Line Revolving
Create a Home Valuation Report for This Property
The Home Valuation Report is an in-depth analysis detailing your home's value as well as a comparison with similar homes in the area
Home Values in the Area
Average Home Value in this Area
Purchase History
| Date | Buyer | Sale Price | Title Company |
|---|---|---|---|
| Stow Terry Lee | $38,000 | Fidelity National Title Co | |
| Herrera David Anthony | $245,000 | Fidelity Title Co | |
| Deckard Daniel L | $166,000 | Fidelity Title Co |
Source: Public Records
Mortgage History
| Date | Status | Borrower | Loan Amount |
|---|---|---|---|
| Previous Owner | Herrera David Anthony | $49,000 | |
| Previous Owner | Herrera David Anthony | $196,000 | |
| Previous Owner | Deckard Daniel L | $20,000 | |
| Previous Owner | Deckard Daniel L | $129,300 |
Source: Public Records
Tax History Compared to Growth
Tax History
| Year | Tax Paid | Tax Assessment Tax Assessment Total Assessment is a certain percentage of the fair market value that is determined by local assessors to be the total taxable value of land and additions on the property. | Land | Improvement |
|---|---|---|---|---|
| 2025 | $577 | $49,042 | $12,905 | $36,137 |
| 2024 | $577 | $48,081 | $12,652 | $35,429 |
| 2023 | $560 | $47,139 | $12,404 | $34,735 |
| 2022 | $553 | $46,215 | $12,161 | $34,054 |
| 2021 | $548 | $45,310 | $11,923 | $33,387 |
| 2020 | $536 | $44,846 | $11,801 | $33,045 |
| 2019 | $524 | $43,968 | $11,570 | $32,398 |
| 2018 | $540 | $43,107 | $11,344 | $31,763 |
| 2017 | $516 | $42,263 | $11,122 | $31,141 |
| 2016 | $502 | $41,435 | $10,904 | $30,531 |
| 2015 | $470 | $40,814 | $10,741 | $30,073 |
| 2014 | $465 | $40,015 | $10,531 | $29,484 |
Source: Public Records
Map
Nearby Homes
- 2275 Dover Ave
- 2051 Thrush Way
- 2033 Thrush Way
- 2429 Baltic Dr
- 730 Capricorn Cir
- 2024 San Luis St
- 2564 Sunrise Dr
- 1973 Finch Way
- 2571 Sunrise Dr
- 1012 Tanager Ln
- Arlo Plan at Villages at Fairfield - Summerwalk at the Villages
- Bennett Plan at Villages at Fairfield - Summerwalk at the Villages
- Carson Plan at Villages at Fairfield - Summerwalk at the Villages
- Darby Plan at Villages at Fairfield - Summerwalk at the Villages
- 1032 Wood Hollow Cir
- 424 Chelsea Way
- 1030 Meadowlark Dr
- 1870 San Pedro Ct
- 205 Alaska Ave
- 50 Anza Ct
- 111 El Verano Ct
- 110 El Verano Ct
- 57 El Toro Ct
- 109 El Verano Ct
- 108 El Verano Ct
- 59 El Toro Ct
- 95 El Verano Ct
- 106 El Verano Ct
- 19 El Dorado Ct
- 107 El Verano Ct
- 60 El Toro Ct Unit 3
- 96 El Verano Ct
- 51 El Basset Ct
- 104 El Verano Ct
- 52 El Basset Ct
- 31 El Basset Ct Unit 3
- 53 El Basset Ct
- 97 El Verano Ct
- 103 El Verano Ct