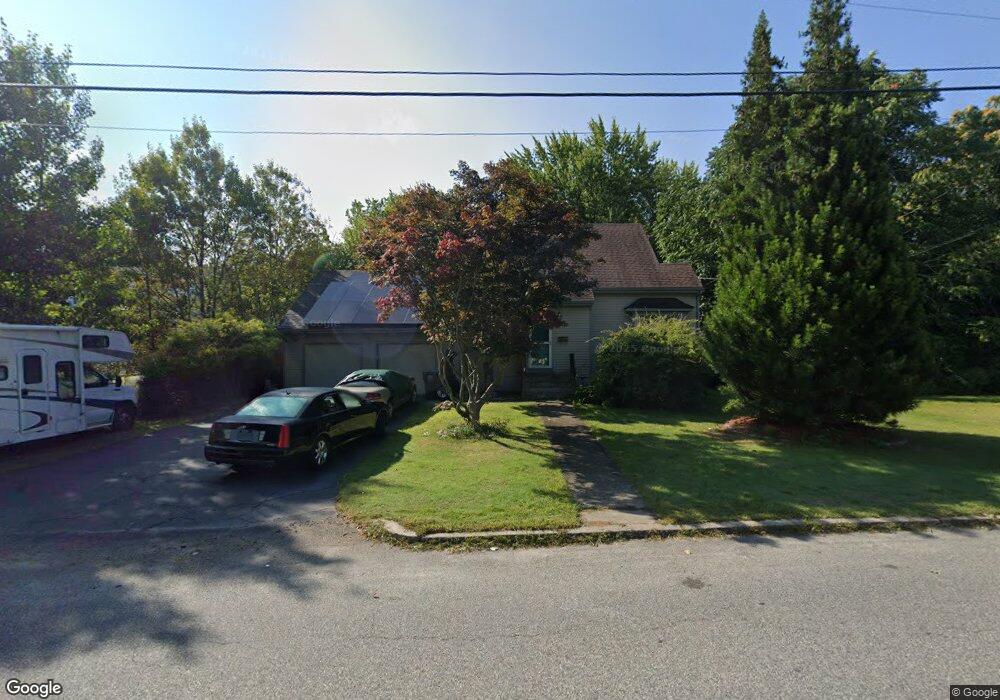
112 Elena St Cranston, RI 02920
Thornton NeighborhoodEstimated Value: $471,354 - $571,000
3
Beds
2
Baths
1,954
Sq Ft
$273/Sq Ft
Est. Value
About This Home
This home is located at 112 Elena St, Cranston, RI 02920 and is currently estimated at $534,339, approximately $273 per square foot. 112 Elena St is a home located in Providence County with nearby schools including Stone Hill School, Western Hills Middle School, and Cranston High School West.
Ownership History
Date
Name
Owned For
Owner Type
Purchase Details
Closed on
Nov 24, 2003
Sold by
Gouise Marguerite
Bought by
Delise Pasquale
Current Estimated Value
Purchase Details
Closed on
Dec 14, 2001
Sold by
Leone Robert R and Leone Elizabeth
Bought by
Blair Thomas J and Gousie Marguerite
Create a Home Valuation Report for This Property
The Home Valuation Report is an in-depth analysis detailing your home's value as well as a comparison with similar homes in the area
Home Values in the Area
Average Home Value in this Area
Purchase History
| Date | Buyer | Sale Price | Title Company |
|---|---|---|---|
| Delise Pasquale | $260,000 | -- | |
| Blair Thomas J | $195,000 | -- |
Source: Public Records
Mortgage History
| Date | Status | Borrower | Loan Amount |
|---|---|---|---|
| Open | Blair Thomas J | $231,600 | |
| Closed | Blair Thomas J | $78,057 |
Source: Public Records
Tax History
| Year | Tax Paid | Tax Assessment Tax Assessment Total Assessment is a certain percentage of the fair market value that is determined by local assessors to be the total taxable value of land and additions on the property. | Land | Improvement |
|---|---|---|---|---|
| 2025 | $5,792 | $417,300 | $118,700 | $298,600 |
| 2024 | $5,679 | $417,300 | $118,700 | $298,600 |
| 2023 | $5,610 | $296,800 | $81,900 | $214,900 |
| 2022 | $5,494 | $296,800 | $81,900 | $214,900 |
| 2021 | $5,342 | $296,800 | $81,900 | $214,900 |
| 2020 | $4,979 | $239,700 | $85,800 | $153,900 |
| 2019 | $4,979 | $239,700 | $85,800 | $153,900 |
| 2018 | $4,864 | $239,700 | $85,800 | $153,900 |
| 2017 | $4,673 | $203,700 | $78,000 | $125,700 |
| 2016 | $4,573 | $203,700 | $78,000 | $125,700 |
| 2015 | $4,573 | $203,700 | $78,000 | $125,700 |
| 2014 | $4,678 | $204,800 | $78,000 | $126,800 |
Source: Public Records
Map
Nearby Homes
- 93 Elena St
- 00 Burton St
- 83 Valente Dr
- 0 Macera Dr
- 0 Clemence St
- 50 Clemence St Unit 50
- 54 Randall St
- 244 Stony Acre Dr
- 0 Plainfield Pike Unit 1374314
- 73 Maple Ave
- 0 Myrtle Ave
- 9 Baker St
- 15 Vallone Rd
- 333 Phenix Ave
- 9 Southern St
- 85 Vermont St
- 16 Shaw Ave
- 72 Westfield Dr
- 1603 Plainfield Pike Unit G8
- 5 Deluca St
Your Personal Tour Guide
Ask me questions while you tour the home.