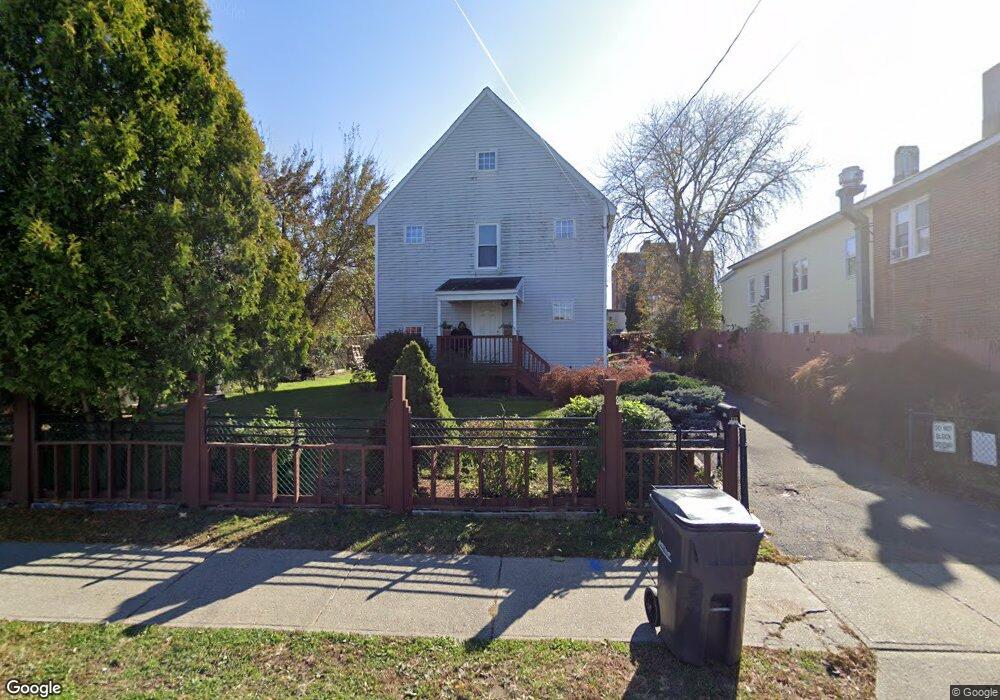
112 Elm St Danbury, CT 06810
Estimated Value: $429,052 - $474,000
4
Beds
2
Baths
1,454
Sq Ft
$314/Sq Ft
Est. Value
About This Home
This home is located at 112 Elm St, Danbury, CT 06810 and is currently estimated at $457,013, approximately $314 per square foot. 112 Elm St is a home located in Fairfield County with nearby schools including King Street Primary School, Broadview Middle School, and Danbury High School.
Ownership History
Date
Name
Owned For
Owner Type
Purchase Details
Closed on
Oct 1, 2021
Sold by
Kondas Corinne
Bought by
Kondas Corinne and Kondas Walter
Current Estimated Value
Purchase Details
Closed on
May 7, 1997
Sold by
Housatonic Habitat
Bought by
Gonzalez Juan and Gonzalez Maria
Home Financials for this Owner
Home Financials are based on the most recent Mortgage that was taken out on this home.
Original Mortgage
$49,500
Interest Rate
7.88%
Create a Home Valuation Report for This Property
The Home Valuation Report is an in-depth analysis detailing your home's value as well as a comparison with similar homes in the area
Home Values in the Area
Average Home Value in this Area
Purchase History
| Date | Buyer | Sale Price | Title Company |
|---|---|---|---|
| Kondas Corinne | -- | None Available | |
| Gonzalez Juan | $125,000 | -- | |
| Gonzalez Juan | $125,000 | -- |
Source: Public Records
Mortgage History
| Date | Status | Borrower | Loan Amount |
|---|---|---|---|
| Previous Owner | Gonzalez Juan | $49,500 | |
| Closed | Gonzalez Juan | $75,000 |
Source: Public Records
Tax History Compared to Growth
Tax History
| Year | Tax Paid | Tax Assessment Tax Assessment Total Assessment is a certain percentage of the fair market value that is determined by local assessors to be the total taxable value of land and additions on the property. | Land | Improvement |
|---|---|---|---|---|
| 2025 | $6,418 | $256,830 | $50,540 | $206,290 |
| 2024 | $6,277 | $256,830 | $50,540 | $206,290 |
| 2023 | $5,992 | $256,830 | $50,540 | $206,290 |
| 2022 | $4,662 | $165,200 | $53,100 | $112,100 |
| 2021 | $4,560 | $165,200 | $53,100 | $112,100 |
| 2020 | $4,560 | $165,200 | $53,100 | $112,100 |
| 2019 | $4,560 | $165,200 | $53,100 | $112,100 |
| 2018 | $4,560 | $165,200 | $53,100 | $112,100 |
| 2017 | $4,232 | $146,200 | $50,600 | $95,600 |
| 2016 | $4,193 | $146,200 | $50,600 | $95,600 |
| 2015 | $4,132 | $146,200 | $50,600 | $95,600 |
| 2014 | $4,035 | $146,200 | $50,600 | $95,600 |
Source: Public Records
Map
Nearby Homes