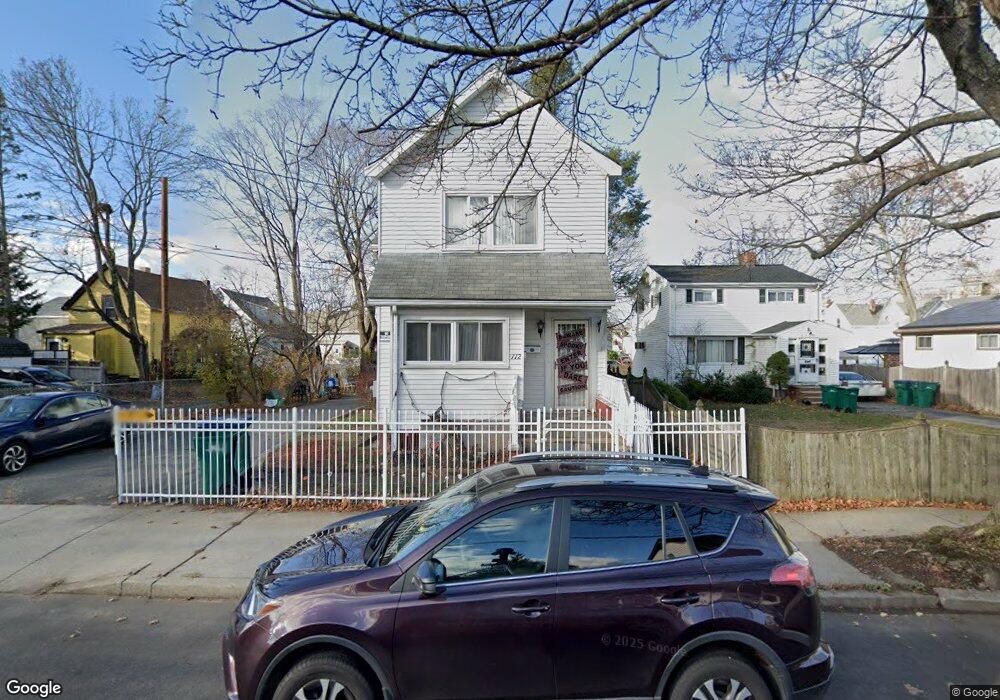
112 Flint St Lynn, MA 01905
Lower Boston Street NeighborhoodEstimated Value: $628,163 - $685,000
4
Beds
3
Baths
1,884
Sq Ft
$348/Sq Ft
Est. Value
About This Home
This home is located at 112 Flint St, Lynn, MA 01905 and is currently estimated at $654,791, approximately $347 per square foot. 112 Flint St is a home located in Essex County with nearby schools including William R. Fallon School, Lincoln-Thomson Elementary School, and Breed Middle School.
Ownership History
Date
Name
Owned For
Owner Type
Purchase Details
Closed on
Feb 4, 2009
Sold by
Bank Of America Na
Bought by
Uddin Nakib
Current Estimated Value
Purchase Details
Closed on
Oct 23, 2007
Sold by
Montero Miguel A
Bought by
Bank Of America Na
Purchase Details
Closed on
Jul 6, 2001
Sold by
Yaing Benjamin M and Yaing Evelyn
Bought by
Montero Miguela and Montero Maria L
Purchase Details
Closed on
Feb 11, 1992
Sold by
Marblehead Sb
Bought by
Yaing Benjamin M and Yaing Evelyn
Purchase Details
Closed on
Aug 5, 1987
Sold by
Flint St Rt
Bought by
T & J Rlty & Invest Tr
Create a Home Valuation Report for This Property
The Home Valuation Report is an in-depth analysis detailing your home's value as well as a comparison with similar homes in the area
Home Values in the Area
Average Home Value in this Area
Purchase History
| Date | Buyer | Sale Price | Title Company |
|---|---|---|---|
| Uddin Nakib | $142,500 | -- | |
| Uddin Nakib | $142,500 | -- | |
| Bank Of America Na | $256,000 | -- | |
| Bank Of America Na | $256,000 | -- | |
| Montero Miguela | $239,000 | -- | |
| Montero Miguela | $239,000 | -- | |
| Yaing Benjamin M | $45,000 | -- | |
| Yaing Benjamin M | $45,000 | -- | |
| T & J Rlty & Invest Tr | $170,000 | -- |
Source: Public Records
Mortgage History
| Date | Status | Borrower | Loan Amount |
|---|---|---|---|
| Previous Owner | T & J Rlty & Invest Tr | $125,000 | |
| Previous Owner | T & J Rlty & Invest Tr | $80,000 |
Source: Public Records
Tax History
| Year | Tax Paid | Tax Assessment Tax Assessment Total Assessment is a certain percentage of the fair market value that is determined by local assessors to be the total taxable value of land and additions on the property. | Land | Improvement |
|---|---|---|---|---|
| 2025 | $6,701 | $646,824 | $226,600 | $420,224 |
| 2024 | $6,196 | $588,400 | $199,100 | $389,300 |
| 2023 | $6,331 | $567,800 | $205,600 | $362,200 |
| 2022 | $6,071 | $488,400 | $152,300 | $336,100 |
| 2021 | $5,729 | $439,700 | $140,000 | $299,700 |
| 2020 | $5,384 | $401,800 | $134,800 | $267,000 |
| 2019 | $5,245 | $366,800 | $126,900 | $239,900 |
| 2018 | $5,193 | $342,800 | $140,000 | $202,800 |
| 2017 | $4,785 | $306,700 | $116,400 | $190,300 |
| 2016 | $4,487 | $277,300 | $108,900 | $168,400 |
| 2015 | $4,320 | $257,900 | $108,100 | $149,800 |
Source: Public Records
Map
Nearby Homes
- 70 Wyman St
- 46 Wilfred St
- 50-50A Kirtland St
- 73 Waterhill St
- 268 Walnut St
- 590 Boston St Unit 303
- 78-80 Spencer St
- 20 Murray St
- 16 Salem St
- 34 Grove St
- 32 Birch Brook Landing Unit 23
- 32 Birch Brook Landing Unit 25
- 32 Birch Brook Landing Unit 22
- 79 Laurel St
- 32 Birch Brook Rd Unit 13
- 32 Birch Brook Rd Unit 27
- 32 Birch Brook Rd Unit 16
- 32 Birch Brook Rd Unit 1
- 32 Birch Brook Rd Unit 14
- 32 Birch Brook Rd Unit 28
Your Personal Tour Guide
Ask me questions while you tour the home.