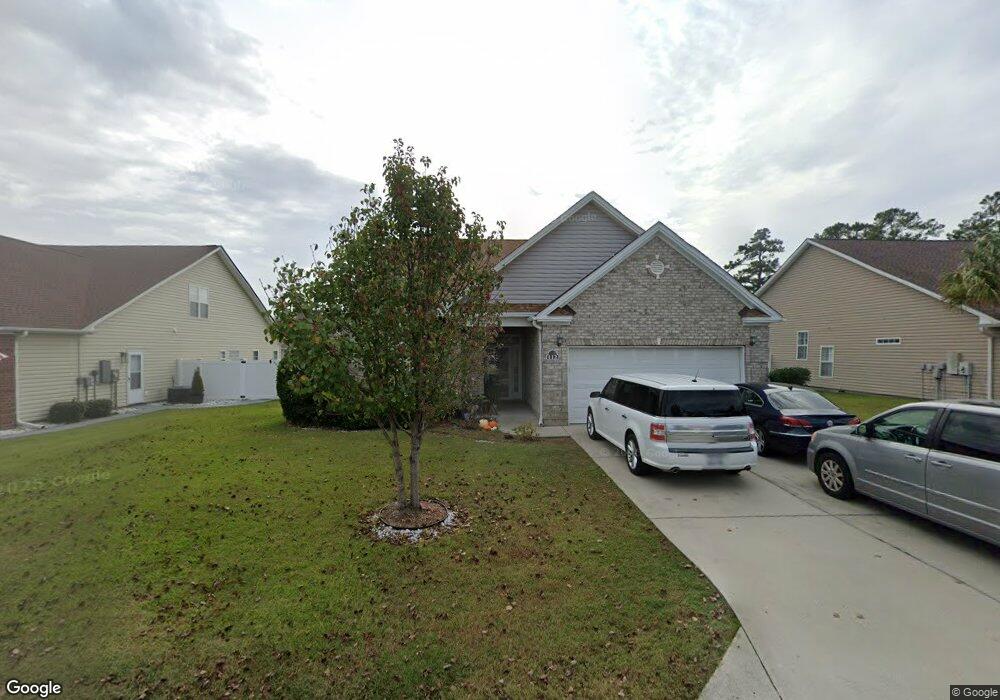
112 Fox Den Dr Unit FOX CHASE @ COLLINS Murrells Inlet, SC 29576
Burgess NeighborhoodEstimated Value: $412,000 - $491,000
4
Beds
3
Baths
2,168
Sq Ft
$207/Sq Ft
Est. Value
About This Home
This home is located at 112 Fox Den Dr Unit FOX CHASE @ COLLINS, Murrells Inlet, SC 29576 and is currently estimated at $449,434, approximately $207 per square foot. 112 Fox Den Dr Unit FOX CHASE @ COLLINS is a home located in Horry County with nearby schools including St. James Elementary School, St. James Middle School, and St. James Intermediate.
Ownership History
Date
Name
Owned For
Owner Type
Purchase Details
Closed on
Oct 11, 2022
Sold by
Phan Tien H
Bought by
Dao Tuyen K and Tuyen K Dao Living Trust
Current Estimated Value
Purchase Details
Closed on
Sep 28, 2020
Sold by
Asad Syed Z
Bought by
Phan Tien H and Dao Tuyen Kim
Home Financials for this Owner
Home Financials are based on the most recent Mortgage that was taken out on this home.
Original Mortgage
$212,250
Interest Rate
2.9%
Mortgage Type
New Conventional
Purchase Details
Closed on
Jul 25, 2017
Sold by
Stiles George M
Bought by
Asad Syed Z and Malik Farhana
Purchase Details
Closed on
Jun 30, 2006
Sold by
Mcquiddy & Johnston Llc
Bought by
Stiles George M and Oropallo Rita M
Home Financials for this Owner
Home Financials are based on the most recent Mortgage that was taken out on this home.
Original Mortgage
$34,635
Interest Rate
6.6%
Mortgage Type
Stand Alone Second
Create a Home Valuation Report for This Property
The Home Valuation Report is an in-depth analysis detailing your home's value as well as a comparison with similar homes in the area
Home Values in the Area
Average Home Value in this Area
Purchase History
| Date | Buyer | Sale Price | Title Company |
|---|---|---|---|
| Dao Tuyen K | -- | -- | |
| Phan Tien H | $283,000 | -- | |
| Asad Syed Z | $197,500 | -- | |
| Stiles George M | $230,900 | None Available |
Source: Public Records
Mortgage History
| Date | Status | Borrower | Loan Amount |
|---|---|---|---|
| Previous Owner | Phan Tien H | $212,250 | |
| Previous Owner | Stiles George M | $34,635 | |
| Previous Owner | Stiles George M | $184,720 | |
| Closed | Asad Syed Z | $0 |
Source: Public Records
Tax History Compared to Growth
Tax History
| Year | Tax Paid | Tax Assessment Tax Assessment Total Assessment is a certain percentage of the fair market value that is determined by local assessors to be the total taxable value of land and additions on the property. | Land | Improvement |
|---|---|---|---|---|
| 2024 | -- | $29,494 | $5,700 | $23,794 |
| 2023 | $5,538 | $11,262 | $2,050 | $9,212 |
| 2021 | $1,155 | $11,262 | $2,050 | $9,212 |
| 2020 | $815 | $9,862 | $2,050 | $7,812 |
| 2019 | $815 | $9,862 | $2,050 | $7,812 |
| 2018 | $734 | $7,704 | $1,492 | $6,212 |
| 2017 | $2,782 | $12,936 | $2,238 | $10,698 |
| 2016 | -- | $12,936 | $2,238 | $10,698 |
| 2015 | $2,782 | $12,936 | $2,238 | $10,698 |
| 2014 | $2,689 | $12,936 | $2,238 | $10,698 |
Source: Public Records
Map
Nearby Homes
- 132 Fox Den Dr
- 321 Deer Path Dr
- 202 Fox Den Dr
- 334 Southern Breezes Cir
- 1111 N Blackmoor Dr
- 1158 Kiawah Loop
- 600 Eastham Ct
- 5804 Longwood Dr Unit 203
- 5828 Longwood Dr Unit 12301
- 5792 Longwood Dr Unit 302
- 313 Whitchurch St
- 5632 S Blackmoor Dr
- 5786 Longwood Dr Unit 202
- 9017 Teal Dr
- 5852 Longwood Dr Unit 302
- 5858 Longwood Dr Unit 201
- 408 Kinsale Ct
- 1845 Groveway Ct
- 492 Grand Cypress Way
- 6578 Wellington Dr
- 112 Fox Den Dr Unit Greenbriar Floor Pla
- 112 Fox Den Dr
- 108 Fox Den Dr Unit Fox Chase
- 108 Fox Den Dr
- 116 Fox Den Dr Unit Fox Chase @ Collins
- 116 Fox Den Dr Unit 116 Fox Den Drive
- 116 Fox Den Dr
- 240 Fox Den Dr
- 244 Fox Den Dr
- 236 Fox Den Dr
- 120 Fox Den Dr
- 111 Fox Den Dr
- 115 Fox Den Dr
- 115 Fox Den Dr Unit Lot. 4-Cumberland B
- 232 Fox Den Dr Unit Fox Chase-Murrells I
- 232 Fox Den Dr Unit 232 Fox Den Drive
- 232 Fox Den Dr
- 124 Fox Den Dr
- 119 Fox Den Dr
- 228 Fox Den Dr