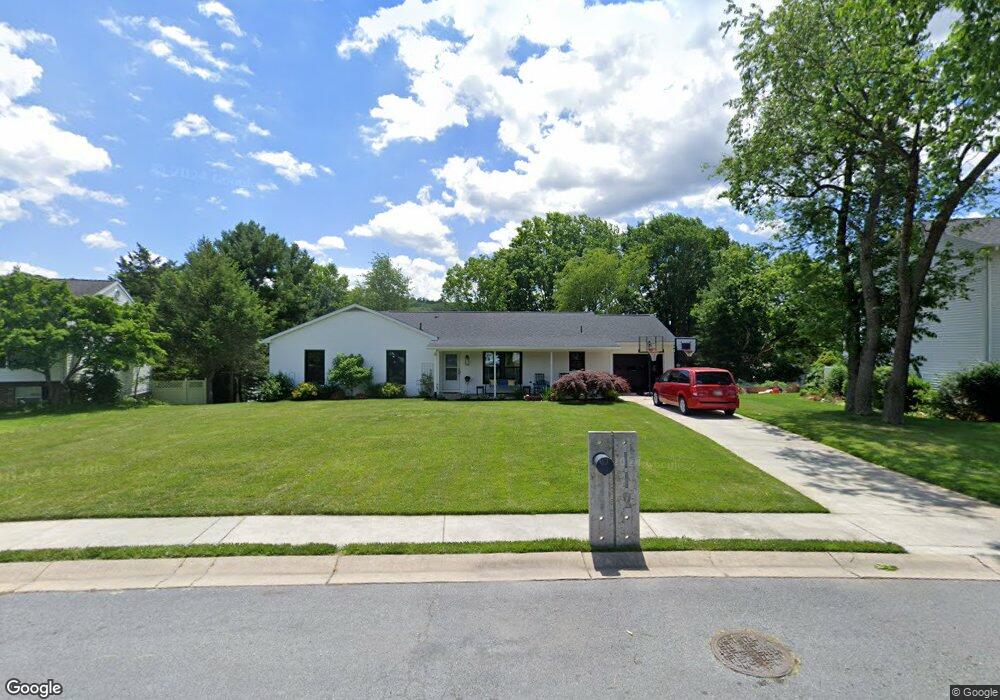
112 Grove Ln Boonsboro, MD 21713
Estimated Value: $330,580 - $413,000
--
Bed
2
Baths
1,682
Sq Ft
$225/Sq Ft
Est. Value
About This Home
This home is located at 112 Grove Ln, Boonsboro, MD 21713 and is currently estimated at $378,145, approximately $224 per square foot. 112 Grove Ln is a home located in Washington County with nearby schools including Boonsboro Elementary School, Boonsboro Middle School, and Boonsboro High School.
Ownership History
Date
Name
Owned For
Owner Type
Purchase Details
Closed on
Jun 6, 2022
Sold by
Seth Reichard Andrew
Bought by
Reichard Andrew Seth and Reichard Whitney Alison
Current Estimated Value
Home Financials for this Owner
Home Financials are based on the most recent Mortgage that was taken out on this home.
Original Mortgage
$245,000
Outstanding Balance
$232,750
Interest Rate
5.09%
Mortgage Type
New Conventional
Estimated Equity
$145,395
Purchase Details
Closed on
Oct 7, 2005
Sold by
Draper B Lorraine Trustee
Bought by
Seth Reichrad Andrew and Alison Harr Whitney
Purchase Details
Closed on
Sep 26, 2005
Sold by
Draper B Lorraine Trustee
Bought by
Seth Reichrad Andrew and Alison Harr Whitney
Purchase Details
Closed on
Jul 16, 2002
Sold by
Lorraine Draper B
Bought by
Draper B Lorraine Trustee
Purchase Details
Closed on
Mar 10, 1989
Sold by
Monument Development Company
Bought by
Draper B Lorraine
Create a Home Valuation Report for This Property
The Home Valuation Report is an in-depth analysis detailing your home's value as well as a comparison with similar homes in the area
Home Values in the Area
Average Home Value in this Area
Purchase History
| Date | Buyer | Sale Price | Title Company |
|---|---|---|---|
| Reichard Andrew Seth | -- | Advantage Title Company | |
| Seth Reichrad Andrew | $285,000 | -- | |
| Seth Reichrad Andrew | $285,000 | -- | |
| Draper B Lorraine Trustee | -- | -- | |
| Draper B Lorraine | $150,000 | -- |
Source: Public Records
Mortgage History
| Date | Status | Borrower | Loan Amount |
|---|---|---|---|
| Open | Reichard Andrew Seth | $245,000 | |
| Closed | Seth Reichrad Andrew | -- |
Source: Public Records
Tax History Compared to Growth
Tax History
| Year | Tax Paid | Tax Assessment Tax Assessment Total Assessment is a certain percentage of the fair market value that is determined by local assessors to be the total taxable value of land and additions on the property. | Land | Improvement |
|---|---|---|---|---|
| 2025 | $2,226 | $273,433 | $0 | $0 |
| 2024 | $2,226 | $244,800 | $62,400 | $182,400 |
| 2023 | $2,120 | $233,533 | $0 | $0 |
| 2022 | $2,019 | $222,267 | $0 | $0 |
| 2021 | $1,931 | $211,000 | $62,400 | $148,600 |
| 2020 | $1,931 | $207,400 | $0 | $0 |
| 2019 | $1,906 | $203,800 | $0 | $0 |
| 2018 | $1,872 | $200,200 | $62,400 | $137,800 |
| 2017 | $1,872 | $200,200 | $0 | $0 |
| 2016 | -- | $200,200 | $0 | $0 |
| 2015 | $2,220 | $219,900 | $0 | $0 |
| 2014 | $2,220 | $219,900 | $0 | $0 |
Source: Public Records
Map
Nearby Homes