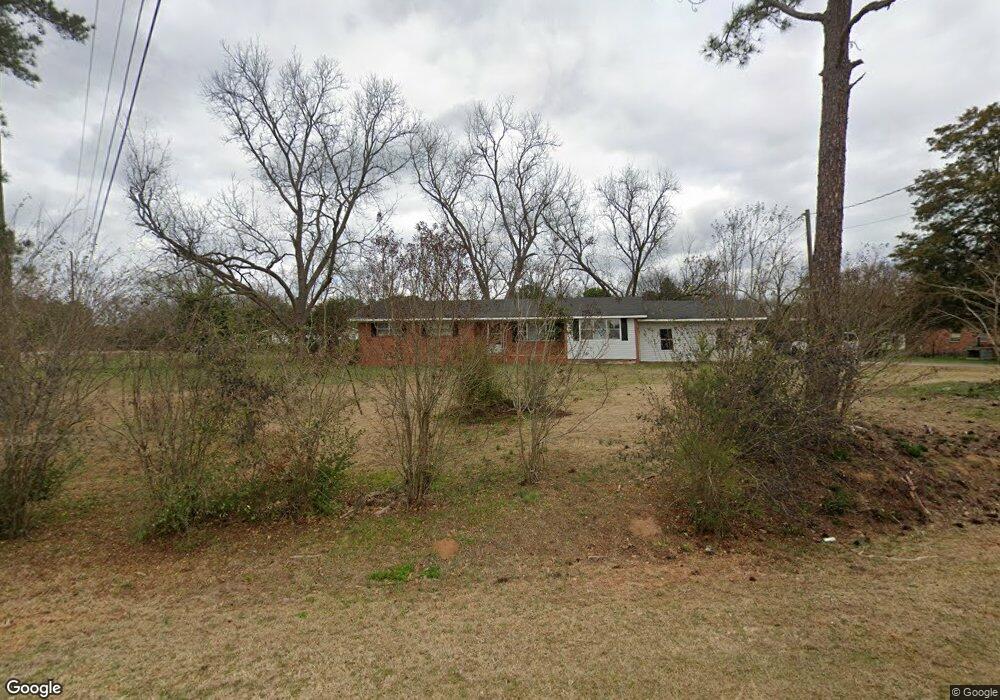
112 Harper Subdivision Americus, GA 31719
Estimated Value: $101,000 - $135,000
3
Beds
2
Baths
1,572
Sq Ft
$74/Sq Ft
Est. Value
About This Home
This home is located at 112 Harper Subdivision, Americus, GA 31719 and is currently estimated at $116,658, approximately $74 per square foot. 112 Harper Subdivision is a home located in Sumter County with nearby schools including Sumter County Primary School, Sumter County Elementary School, and Sumter County Middle School.
Ownership History
Date
Name
Owned For
Owner Type
Purchase Details
Closed on
Dec 19, 2018
Sold by
Secretary Of Dept Of Housing And Urban D
Bought by
Madhavi Rental Llc
Current Estimated Value
Purchase Details
Closed on
Sep 13, 2017
Sold by
Citimortgage Inc
Bought by
Secretary Of Housing And Urban
Purchase Details
Closed on
Jul 5, 2017
Sold by
Walters Reginald
Bought by
Citimortgage Inc
Purchase Details
Closed on
Oct 22, 2012
Sold by
Walters Yolunda L
Bought by
Walters Reginald K
Purchase Details
Closed on
Jul 6, 2000
Sold by
Mcafee C William
Bought by
Walters Reginald
Purchase Details
Closed on
Dec 5, 1978
Sold by
Justice Floyd E
Bought by
Mcafee C William
Purchase Details
Closed on
Jul 26, 1978
Sold by
Deriso Chas M and Deriso Hd
Bought by
Justice Floyd E
Purchase Details
Closed on
Oct 1, 1970
Bought by
Deriso Chas M and Deriso Hd
Create a Home Valuation Report for This Property
The Home Valuation Report is an in-depth analysis detailing your home's value as well as a comparison with similar homes in the area
Purchase History
| Date | Buyer | Sale Price | Title Company |
|---|---|---|---|
| Madhavi Rental Llc | $40,150 | -- | |
| Secretary Of Housing And Urban | -- | -- | |
| Citimortgage Inc | $65,145 | -- | |
| Walters Reginald K | -- | -- | |
| Walters Reginald | $77,000 | -- | |
| Mcafee C William | -- | -- | |
| Justice Floyd E | -- | -- | |
| Deriso Chas M | -- | -- |
Source: Public Records
Tax History
| Year | Tax Paid | Tax Assessment Tax Assessment Total Assessment is a certain percentage of the fair market value that is determined by local assessors to be the total taxable value of land and additions on the property. | Land | Improvement |
|---|---|---|---|---|
| 2025 | $1,502 | $33,240 | $3,000 | $30,240 |
| 2024 | $1,502 | $33,240 | $3,000 | $30,240 |
| 2023 | $1,470 | $33,240 | $3,000 | $30,240 |
| 2022 | $1,470 | $33,240 | $3,000 | $30,240 |
| 2021 | $1,472 | $33,240 | $3,000 | $30,240 |
| 2020 | $1,507 | $33,240 | $3,000 | $30,240 |
| 2019 | $1,435 | $33,240 | $3,000 | $30,240 |
| 2018 | $1,435 | $33,240 | $3,000 | $30,240 |
| 2017 | $1,372 | $33,240 | $3,000 | $30,240 |
| 2016 | $1,373 | $33,240 | $3,000 | $30,240 |
| 2015 | $1,471 | $37,080 | $3,000 | $34,080 |
| 2014 | $1,473 | $37,080 | $3,000 | $34,080 |
| 2013 | -- | $37,080 | $3,000 | $34,080 |
Source: Public Records
Map
Nearby Homes
- 195 Horseshoe Cir
- 154 Lawhorn Cir Unit Tuck
- 100 Odum Rd
- 0 Wolf Creek Dr
- Lot 38 Wolf Creek Dr
- 207 Wolf Creek Dr
- Lot 73 & 74 Wolf Creek Dr
- 205 U S 19
- 000 U S Highway 19
- 104 Westlake Cir
- 419 W Furlow St
- 533 Harrold Ave
- 527 Harrold Ave
- 130 Mallard Ln
- 525 Hancock Dr
- 914 Adderton St
- 501 S Lee St
- 1202 S Lee St
- 522 S Lee St
- 240-248 James Hart Rd
- 108 Joe Harper Road Extension
- 108 Harper Subdivision
- 115 Harper Subdivision
- 112 Joe Harper Rd
- 105 Joe Harper Rd
- 112 Joe Harper Road Extension
- 107 Joe Harper Road Extension
- 102 Harper Subdivision
- 111 Joe Harper Road Extension
- 105 Harper Subdivision
- 116 Joe Harper Road Extension
- 270 Ga Highway 49 S
- 121 Joe Harper Rd
- 206 Harper Subdivision
- TBD Joe Harper Rd
- 238 Ga Highway 49 S
- 278 Ga Highway 49 S
- 259 Ga Highway 49 S
- 178 Joe Harper Rd
- 265 Ga Highway 49 S
Your Personal Tour Guide
Ask me questions while you tour the home.