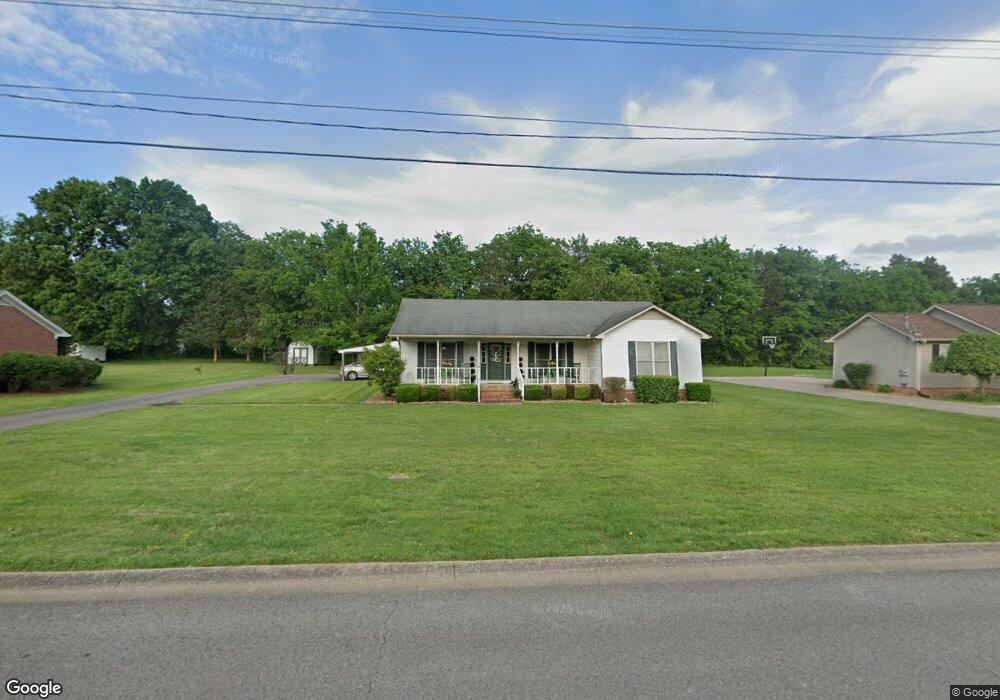
112 Idle Dr Shelbyville, TN 37160
Estimated Value: $311,129 - $454,000
--
Bed
2
Baths
2,494
Sq Ft
$155/Sq Ft
Est. Value
About This Home
This home is located at 112 Idle Dr, Shelbyville, TN 37160 and is currently estimated at $386,782, approximately $155 per square foot. 112 Idle Dr is a home located in Bedford County with nearby schools including Harris Middle School and Victory Baptist Academy.
Ownership History
Date
Name
Owned For
Owner Type
Purchase Details
Closed on
Aug 4, 2003
Sold by
Williams Michael and Williams Kimberl
Bought by
Looper Terry and Looper Marcia
Current Estimated Value
Home Financials for this Owner
Home Financials are based on the most recent Mortgage that was taken out on this home.
Original Mortgage
$116,000
Interest Rate
5.42%
Purchase Details
Closed on
Oct 15, 1997
Sold by
Brown Joe Randal
Bought by
Williams Michael E and Williams Kimbe
Home Financials for this Owner
Home Financials are based on the most recent Mortgage that was taken out on this home.
Original Mortgage
$83,382
Interest Rate
7.39%
Purchase Details
Closed on
Sep 29, 1994
Sold by
Boyce Larry and Boyce Linda
Bought by
Brown Joe and Brown Kimberly
Purchase Details
Closed on
Aug 31, 1993
Bought by
Boyce Larry Leslie and Boyce Linda F
Purchase Details
Closed on
May 16, 1972
Bought by
Cartwright Thomas and Bobby Cartwrigh
Create a Home Valuation Report for This Property
The Home Valuation Report is an in-depth analysis detailing your home's value as well as a comparison with similar homes in the area
Home Values in the Area
Average Home Value in this Area
Purchase History
| Date | Buyer | Sale Price | Title Company |
|---|---|---|---|
| Looper Terry | $116,000 | -- | |
| Williams Michael E | $8,000 | -- | |
| Brown Joe | -- | -- | |
| Boyce Larry Leslie | $65,000 | -- | |
| Cartwright Thomas | -- | -- |
Source: Public Records
Mortgage History
| Date | Status | Borrower | Loan Amount |
|---|---|---|---|
| Closed | Cartwright Thomas | $116,000 | |
| Previous Owner | Cartwright Thomas | $83,382 |
Source: Public Records
Tax History Compared to Growth
Tax History
| Year | Tax Paid | Tax Assessment Tax Assessment Total Assessment is a certain percentage of the fair market value that is determined by local assessors to be the total taxable value of land and additions on the property. | Land | Improvement |
|---|---|---|---|---|
| 2025 | -- | $58,100 | $0 | $0 |
| 2024 | -- | $58,100 | $8,250 | $49,850 |
| 2023 | $2,211 | $58,100 | $8,250 | $49,850 |
| 2022 | $2,275 | $58,100 | $8,250 | $49,850 |
| 2021 | $2,066 | $58,100 | $8,250 | $49,850 |
| 2020 | $1,624 | $58,100 | $8,250 | $49,850 |
| 2019 | $1,624 | $36,650 | $4,600 | $32,050 |
| 2018 | $1,587 | $36,650 | $4,600 | $32,050 |
| 2017 | $1,587 | $36,650 | $4,600 | $32,050 |
| 2016 | $1,572 | $36,650 | $4,600 | $32,050 |
| 2015 | $1,572 | $36,650 | $4,600 | $32,050 |
| 2014 | $1,374 | $35,062 | $0 | $0 |
Source: Public Records
Map
Nearby Homes
- 106 Ledgeview Dr
- 11 Amos Smith Rd
- 807 Shoma Dr
- 216 Idle Dr
- 217 Idle Dr
- 227 Idle Dr
- 229 Idle Dr
- 215 Idle Dr
- 219 Idle Dr
- 221 Idle Dr
- 225 Idle Dr
- 222 Idle Dr
- 223 Idle Dr
- 108 Virginia Ct
- 301 Idle Dr
- Prelude Plan at Idle Reserve
- Wayfare Plan at Idle Reserve
- Venture Plan at Idle Reserve
- 307 Ledgeview Dr
- 104 Curbow Ct