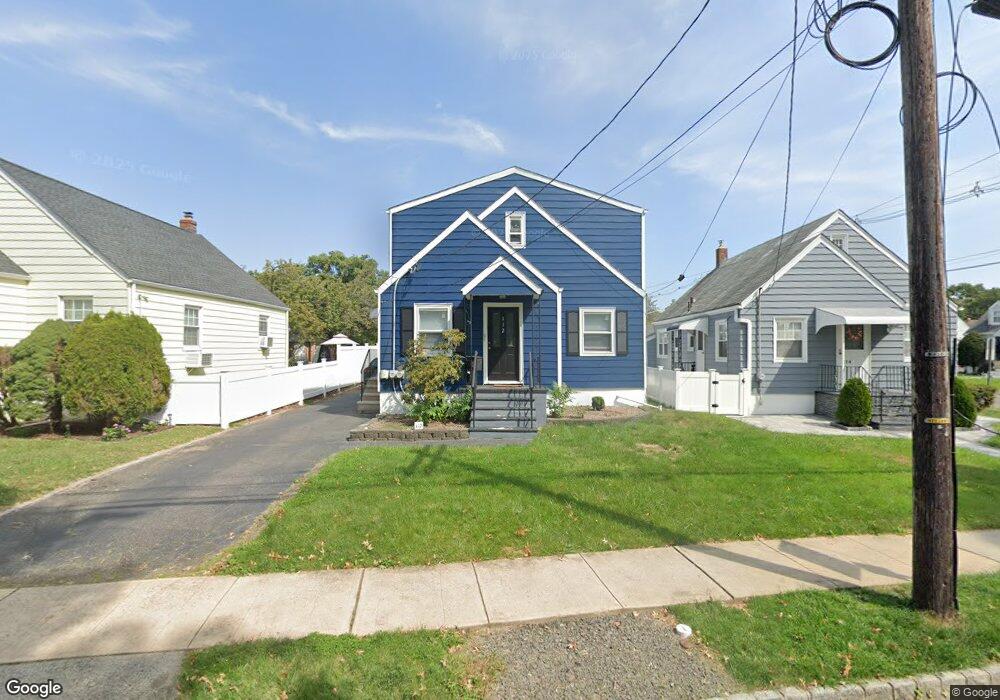
112 James St Unit 2 Bloomfield, NJ 07003
Estimated Value: $597,000 - $686,000
1
Bed
1
Bath
--
Sq Ft
4,051
Sq Ft Lot
About This Home
This home is located at 112 James St Unit 2, Bloomfield, NJ 07003 and is currently estimated at $637,445. 112 James St Unit 2 is a home located in Essex County with nearby schools including Franklin School, Bloomfield Middle School, and Bloomfield High School.
Ownership History
Date
Name
Owned For
Owner Type
Purchase Details
Closed on
Oct 23, 2025
Sold by
Franck Rukerandanga and Franck Darlene Ngabirano
Bought by
Perrone Paula
Current Estimated Value
Home Financials for this Owner
Home Financials are based on the most recent Mortgage that was taken out on this home.
Original Mortgage
$657,864
Outstanding Balance
$657,251
Interest Rate
6.34%
Mortgage Type
FHA
Estimated Equity
-$19,806
Purchase Details
Closed on
Sep 7, 2021
Sold by
Allen Matthew
Bought by
Rukerandanga Franck and Ngabirano Darlene
Home Financials for this Owner
Home Financials are based on the most recent Mortgage that was taken out on this home.
Original Mortgage
$500,762
Interest Rate
2.8%
Mortgage Type
FHA
Purchase Details
Closed on
May 6, 2004
Sold by
Batt Robert
Bought by
Allen Matthew
Home Financials for this Owner
Home Financials are based on the most recent Mortgage that was taken out on this home.
Original Mortgage
$272,000
Interest Rate
5.75%
Create a Home Valuation Report for This Property
The Home Valuation Report is an in-depth analysis detailing your home's value as well as a comparison with similar homes in the area
Home Values in the Area
Average Home Value in this Area
Purchase History
| Date | Buyer | Sale Price | Title Company |
|---|---|---|---|
| Perrone Paula | $670,000 | Foundation Title | |
| Rukerandanga Franck | $510,000 | Westcor Land Title | |
| Allen Matthew | $340,000 | -- | |
| -- | $34,000 | -- |
Source: Public Records
Mortgage History
| Date | Status | Borrower | Loan Amount |
|---|---|---|---|
| Open | Perrone Paula | $657,864 | |
| Previous Owner | Rukerandanga Franck | $500,762 | |
| Previous Owner | -- | $272,000 |
Source: Public Records
Tax History Compared to Growth
Tax History
| Year | Tax Paid | Tax Assessment Tax Assessment Total Assessment is a certain percentage of the fair market value that is determined by local assessors to be the total taxable value of land and additions on the property. | Land | Improvement |
|---|---|---|---|---|
| 2025 | $12,330 | $377,300 | $124,900 | $252,400 |
| 2024 | $12,330 | $377,300 | $124,900 | $252,400 |
| 2022 | $11,831 | $369,500 | $124,900 | $244,600 |
| 2021 | $11,613 | $369,500 | $124,900 | $244,600 |
| 2020 | $11,436 | $369,500 | $124,900 | $244,600 |
| 2019 | $10,167 | $255,400 | $123,500 | $131,900 |
| 2018 | $10,124 | $255,400 | $123,500 | $131,900 |
| 2017 | $9,971 | $255,400 | $123,500 | $131,900 |
| 2016 | $9,858 | $255,400 | $123,500 | $131,900 |
| 2015 | $9,769 | $255,400 | $123,500 | $131,900 |
| 2014 | $9,590 | $255,400 | $123,500 | $131,900 |
Source: Public Records
Map
Nearby Homes
- 31 Spring St
- 50 James St Unit 3
- 27 Gillespie Rd
- 366 Hoover Ave Unit 119
- 10 Almira St Unit 14
- 10 14almira St
- 328 Hoover Ave
- 328-330 Hoover Ave
- 322 Hoover Ave Unit 73
- 298 Hoover Ave Unit 28
- 28 Forest Dr
- 39 Forest Dr
- 267 Hoover Ave
- 152 Belleville Ave Unit 1
- 36 Clarendon Place
- 40 Brighton Ave
- 33 Oak St
- 73 Hoover Ave
- 48 Broughton Ave
- 48 Broughton Ave Unit 2