Estimated Value: $137,000 - $190,000
3
Beds
2
Baths
1,388
Sq Ft
$119/Sq Ft
Est. Value
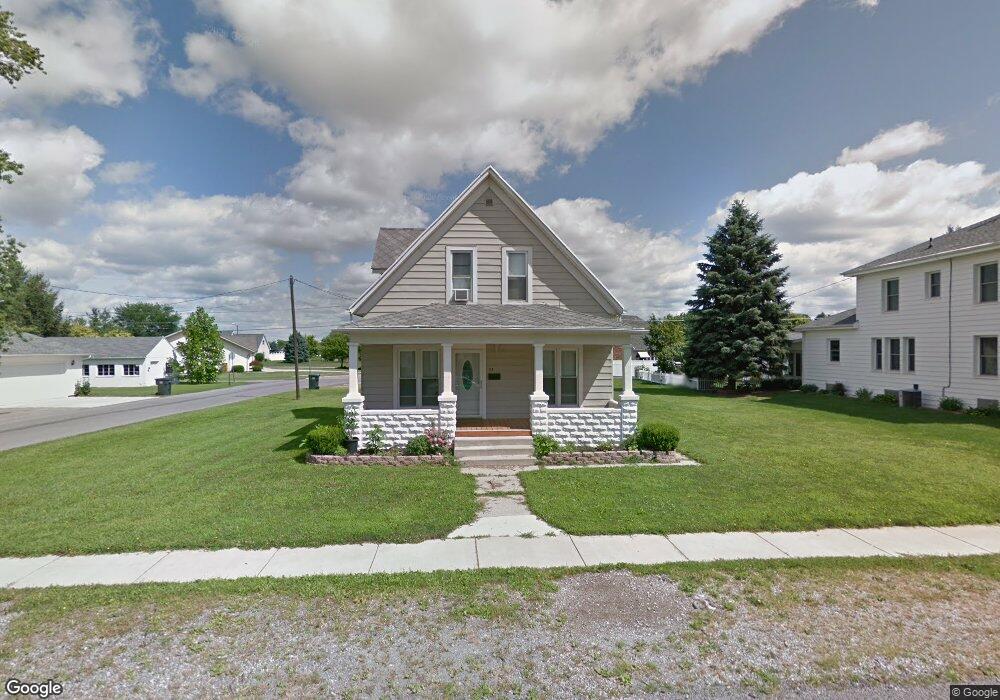
About This Home
This home is located at 112 Johns Ave, Lima, OH 45807 and is currently estimated at $164,727, approximately $118 per square foot. 112 Johns Ave is a home located in Allen County with nearby schools including Elida Elementary School, Elida Middle School, and Elida High School.
Ownership History
Date
Name
Owned For
Owner Type
Purchase Details
Closed on
May 22, 2008
Sold by
Ribley Craig
Bought by
Two Story Investments Llc
Current Estimated Value
Home Financials for this Owner
Home Financials are based on the most recent Mortgage that was taken out on this home.
Original Mortgage
$66,200
Outstanding Balance
$40,578
Interest Rate
5.87%
Mortgage Type
Purchase Money Mortgage
Estimated Equity
$124,149
Purchase Details
Closed on
Mar 11, 2005
Sold by
Hutchins Dave J and Hutchins Amy L
Bought by
Ribley Craig
Home Financials for this Owner
Home Financials are based on the most recent Mortgage that was taken out on this home.
Original Mortgage
$90,000
Interest Rate
6.62%
Mortgage Type
Adjustable Rate Mortgage/ARM
Purchase Details
Closed on
Oct 21, 1988
Bought by
Grady Michael W
Create a Home Valuation Report for This Property
The Home Valuation Report is an in-depth analysis detailing your home's value as well as a comparison with similar homes in the area
Purchase History
We collect this data history from publicly available records. To have your information removed, we recommend requesting removal directly through your county’s website.
| Date | Buyer | Sale Price | Title Company |
|---|---|---|---|
| Two Story Investments Llc | $52,000 | Attorney | |
| Ribley Craig | $90,000 | None Available | |
| Grady Michael W | $40,000 | -- |
Source: Public Records
Mortgage History
We collect this data history from publicly available records. To have your information removed, we recommend requesting removal directly through your county’s website.
| Date | Status | Borrower | Loan Amount |
|---|---|---|---|
| Open | Two Story Investments Llc | $66,200 | |
| Previous Owner | Ribley Craig | $90,000 |
Source: Public Records
Tax History
| Year | Tax Paid | Tax Assessment Tax Assessment Total Assessment is a certain percentage of the fair market value that is determined by local assessors to be the total taxable value of land and additions on the property. | Land | Improvement |
|---|---|---|---|---|
| 2025 | $1,447 | $32,840 | $6,550 | $26,290 |
| 2024 | $1,468 | $32,840 | $6,550 | $26,290 |
| 2023 | $1,256 | $25,070 | $5,010 | $20,060 |
| 2022 | $1,282 | $25,070 | $5,010 | $20,060 |
| 2021 | $1,288 | $25,070 | $5,010 | $20,060 |
| 2020 | $1,187 | $21,490 | $4,760 | $16,730 |
| 2019 | $1,187 | $21,490 | $4,760 | $16,730 |
| 2018 | $1,195 | $21,490 | $4,760 | $16,730 |
| 2017 | $1,060 | $19,710 | $4,760 | $14,950 |
| 2016 | $1,061 | $19,710 | $4,760 | $14,950 |
| 2015 | $1,065 | $19,710 | $4,760 | $14,950 |
| 2014 | $1,065 | $18,970 | $4,760 | $14,210 |
| 2013 | $971 | $18,970 | $4,760 | $14,210 |
Source: Public Records
Map
Nearby Homes
- 207 Sunnydale St
- 5724 Clover Ridge Dr
- 5654 Clover Ridge Dr
- 5643 Clover Ridge Dr
- 5117 Willow St
- 3960 Pioneer Rd
- 2148 Larkspur Dr
- 4839 Sycamore St
- 4795 Sycamore St
- 5014 Lobo St
- 0 Alix Dr
- 2568 Susan Ann Dr
- 4848 Marciel Dr
- 0000 Baty Rd
- 3755 Grubb Rd N
- 1839 Baty Rd
- 3794 N Cable Rd
- 3755 Comanche
- 3739 Comanche
- 3721 Comanche
Your Personal Tour Guide
Ask me questions while you tour the home.