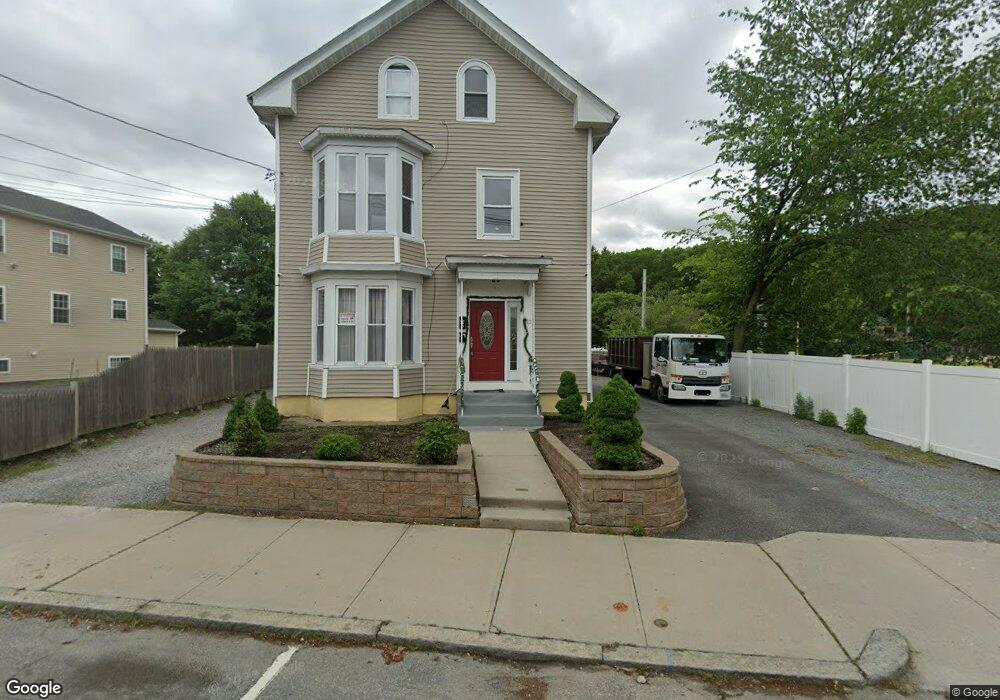
112 Killingly St Providence, RI 02909
Silver Lake NeighborhoodEstimated Value: $517,000 - $610,000
4
Beds
2
Baths
2,728
Sq Ft
$208/Sq Ft
Est. Value
About This Home
This home is located at 112 Killingly St, Providence, RI 02909 and is currently estimated at $568,048, approximately $208 per square foot. 112 Killingly St is a home located in Providence County with nearby schools including Achievement First Promesa, Achievement First Providence Mayoral Academy Elementary School, and Achievement First Providence Mayoral Academy Elementary.
Ownership History
Date
Name
Owned For
Owner Type
Purchase Details
Closed on
Nov 13, 2018
Sold by
My Dream Home Realty L
Bought by
Mainato Luis A
Current Estimated Value
Home Financials for this Owner
Home Financials are based on the most recent Mortgage that was taken out on this home.
Original Mortgage
$41,500
Outstanding Balance
$36,271
Interest Rate
4.7%
Mortgage Type
New Conventional
Estimated Equity
$531,777
Purchase Details
Closed on
Nov 2, 2018
Sold by
Greenwich Capital Part
Bought by
My Dream Home Realty L
Home Financials for this Owner
Home Financials are based on the most recent Mortgage that was taken out on this home.
Original Mortgage
$41,500
Outstanding Balance
$36,271
Interest Rate
4.7%
Mortgage Type
New Conventional
Estimated Equity
$531,777
Purchase Details
Closed on
May 6, 2013
Sold by
Jones Raymond M and Fnma
Bought by
Federal National Mortgage Association
Purchase Details
Closed on
Jan 21, 1999
Sold by
Gardiner Allen W and Ennis John B
Bought by
Anderson Michael and Anderson Christine
Create a Home Valuation Report for This Property
The Home Valuation Report is an in-depth analysis detailing your home's value as well as a comparison with similar homes in the area
Home Values in the Area
Average Home Value in this Area
Purchase History
| Date | Buyer | Sale Price | Title Company |
|---|---|---|---|
| Mainato Luis A | $211,500 | -- | |
| My Dream Home Realty L | $160,000 | -- | |
| Greenwich Capital Part | $142,500 | -- | |
| Federal National Mortgage Association | $293,164 | -- | |
| Anderson Michael | $82,000 | -- |
Source: Public Records
Mortgage History
| Date | Status | Borrower | Loan Amount |
|---|---|---|---|
| Open | Mainato Luis A | $41,500 | |
| Open | Greenwich Capital Part | $128,000 | |
| Previous Owner | Anderson Michael | $212,000 | |
| Previous Owner | Anderson Michael | $175,000 | |
| Previous Owner | Anderson Michael | $125,000 |
Source: Public Records
Tax History
| Year | Tax Paid | Tax Assessment Tax Assessment Total Assessment is a certain percentage of the fair market value that is determined by local assessors to be the total taxable value of land and additions on the property. | Land | Improvement |
|---|---|---|---|---|
| 2025 | $4,029 | $533,700 | $139,800 | $393,900 |
| 2024 | $6,263 | $341,300 | $88,400 | $252,900 |
| 2023 | $6,263 | $341,300 | $88,400 | $252,900 |
| 2022 | $6,075 | $341,300 | $88,400 | $252,900 |
| 2021 | $5,420 | $220,700 | $53,200 | $167,500 |
| 2020 | $5,420 | $220,700 | $53,200 | $167,500 |
| 2019 | $5,420 | $220,700 | $53,200 | $167,500 |
| 2018 | $4,749 | $148,600 | $45,400 | $103,200 |
| 2017 | $4,749 | $148,600 | $45,400 | $103,200 |
| 2016 | $4,749 | $148,600 | $45,400 | $103,200 |
| 2015 | $4,316 | $130,400 | $45,400 | $85,000 |
| 2014 | $4,401 | $130,400 | $45,400 | $85,000 |
| 2013 | $4,401 | $130,400 | $45,400 | $85,000 |
Source: Public Records
Map
Nearby Homes
- 665 Plainfield St
- 231 Lowell Ave
- 60 Ophelia St
- 240 Eastwood Ave
- 10 Mott St
- 162 Merino St
- 18 Crowninshield St
- 15 Melissa St
- 102 Ophelia St
- 68 Murray St
- 140 Cleveland St
- 0 Orchard St Unit 1396400
- 0 Orchard St Unit 1400488
- 0 Orchard St Unit 1395201
- 649 Union Ave
- 173 Whittier Ave
- 33 Prudence Ave
- 29 Matson Ave Unit 35
- 64 Ralph St
- 620 Union Ave
Your Personal Tour Guide
Ask me questions while you tour the home.