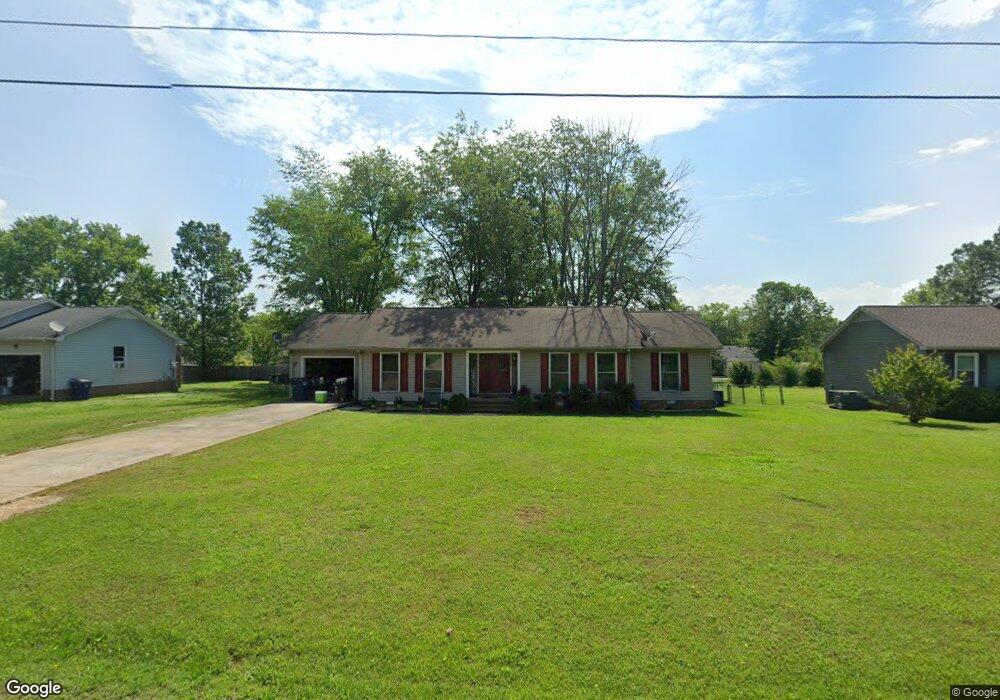
112 Lantern Ln Shelbyville, TN 37160
Estimated Value: $240,690 - $310,000
--
Bed
2
Baths
1,476
Sq Ft
$192/Sq Ft
Est. Value
About This Home
This home is located at 112 Lantern Ln, Shelbyville, TN 37160 and is currently estimated at $282,673, approximately $191 per square foot. 112 Lantern Ln is a home located in Bedford County with nearby schools including South Side Elementary School, Harris Middle School, and Christian Chapel Academy.
Ownership History
Date
Name
Owned For
Owner Type
Purchase Details
Closed on
May 16, 2006
Sold by
Maybee Leigh Ann
Bought by
Cooper Jamie M
Current Estimated Value
Home Financials for this Owner
Home Financials are based on the most recent Mortgage that was taken out on this home.
Original Mortgage
$97,000
Outstanding Balance
$63,865
Interest Rate
6.41%
Estimated Equity
$218,808
Purchase Details
Closed on
Oct 19, 1996
Sold by
Lynch Derrick C
Bought by
Maybee Leigh A and Maybee Phillip
Home Financials for this Owner
Home Financials are based on the most recent Mortgage that was taken out on this home.
Original Mortgage
$65,440
Interest Rate
8.28%
Purchase Details
Closed on
Sep 13, 1991
Bought by
Lynch Derrick C
Purchase Details
Closed on
Jun 12, 1991
Bought by
Mary Raulerson W and Mary Alice
Purchase Details
Closed on
Apr 15, 1991
Bought by
Adcock Robert A and Adcock Margaret B
Purchase Details
Closed on
Apr 4, 1990
Bought by
Kelton Const Inc
Purchase Details
Closed on
Mar 28, 1989
Bought by
Allen Scott W and Allen Reba J
Create a Home Valuation Report for This Property
The Home Valuation Report is an in-depth analysis detailing your home's value as well as a comparison with similar homes in the area
Home Values in the Area
Average Home Value in this Area
Purchase History
| Date | Buyer | Sale Price | Title Company |
|---|---|---|---|
| Cooper Jamie M | $95,000 | -- | |
| Maybee Leigh A | $70,000 | -- | |
| Lynch Derrick C | $65,000 | -- | |
| Mary Raulerson W | $66,000 | -- | |
| Adcock Robert A | -- | -- | |
| Kelton Const Inc | -- | -- | |
| Allen Scott W | -- | -- |
Source: Public Records
Mortgage History
| Date | Status | Borrower | Loan Amount |
|---|---|---|---|
| Open | Allen Scott W | $97,000 | |
| Previous Owner | Allen Scott W | $65,440 |
Source: Public Records
Tax History Compared to Growth
Tax History
| Year | Tax Paid | Tax Assessment Tax Assessment Total Assessment is a certain percentage of the fair market value that is determined by local assessors to be the total taxable value of land and additions on the property. | Land | Improvement |
|---|---|---|---|---|
| 2025 | -- | $38,200 | $0 | $0 |
| 2024 | -- | $38,200 | $7,250 | $30,950 |
| 2023 | $1,453 | $38,200 | $7,250 | $30,950 |
| 2022 | $1,495 | $38,200 | $7,250 | $30,950 |
| 2021 | $1,358 | $38,200 | $7,250 | $30,950 |
| 2020 | $1,186 | $38,200 | $7,250 | $30,950 |
| 2019 | $1,186 | $26,775 | $5,500 | $21,275 |
| 2018 | $1,159 | $26,775 | $5,500 | $21,275 |
| 2017 | $1,159 | $26,775 | $5,500 | $21,275 |
| 2016 | $1,149 | $26,775 | $5,500 | $21,275 |
| 2015 | $1,149 | $26,775 | $5,500 | $21,275 |
| 2014 | $957 | $24,410 | $0 | $0 |
Source: Public Records
Map
Nearby Homes