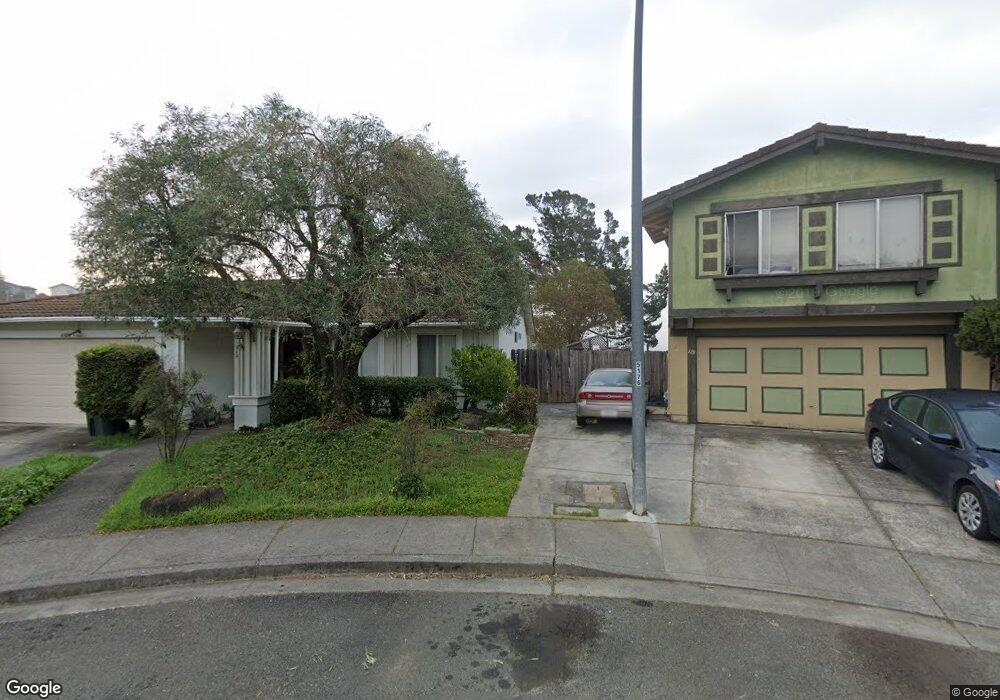
112 Lora Ct Vallejo, CA 94591
Estimated Value: $525,000 - $573,000
3
Beds
2
Baths
1,322
Sq Ft
$419/Sq Ft
Est. Value
About This Home
This home is located at 112 Lora Ct, Vallejo, CA 94591 and is currently estimated at $553,516, approximately $418 per square foot. 112 Lora Ct is a home located in Solano County with nearby schools including Joseph H. Wardlaw Elementary School, Hogan Middle School, and Jesse M. Bethel High School.
Ownership History
Date
Name
Owned For
Owner Type
Purchase Details
Closed on
Jan 27, 2023
Sold by
Filemon Acas And Diana L Acas Family Tru
Bought by
Macaraeg Albert S and Macaraeg Irma F
Current Estimated Value
Home Financials for this Owner
Home Financials are based on the most recent Mortgage that was taken out on this home.
Original Mortgage
$265,000
Outstanding Balance
$256,595
Interest Rate
6.27%
Mortgage Type
New Conventional
Estimated Equity
$296,921
Purchase Details
Closed on
Feb 3, 2004
Sold by
Acas Filemon and Acas Diana L
Bought by
Acas Filemon and Acas Diana L
Purchase Details
Closed on
Jul 28, 2003
Sold by
Acas Diana L
Bought by
Acas Filemon and Acas Diana L
Purchase Details
Closed on
Nov 22, 1995
Sold by
Acas Filemon
Bought by
Acas Diana L
Home Financials for this Owner
Home Financials are based on the most recent Mortgage that was taken out on this home.
Original Mortgage
$137,500
Interest Rate
7.42%
Create a Home Valuation Report for This Property
The Home Valuation Report is an in-depth analysis detailing your home's value as well as a comparison with similar homes in the area
Purchase History
| Date | Buyer | Sale Price | Title Company |
|---|---|---|---|
| Macaraeg Albert S | $525,000 | Old Republic Title | |
| Acas Filemon | -- | -- | |
| Acas Filemon | -- | -- | |
| Acas Diana L | -- | Placer Title Company |
Source: Public Records
Mortgage History
| Date | Status | Borrower | Loan Amount |
|---|---|---|---|
| Open | Macaraeg Albert S | $265,000 | |
| Previous Owner | Acas Diana L | $137,500 |
Source: Public Records
Tax History
| Year | Tax Paid | Tax Assessment Tax Assessment Total Assessment is a certain percentage of the fair market value that is determined by local assessors to be the total taxable value of land and additions on the property. | Land | Improvement |
|---|---|---|---|---|
| 2025 | $7,195 | $546,210 | $156,060 | $390,150 |
| 2024 | $7,195 | $535,500 | $153,000 | $382,500 |
| 2023 | $2,993 | $179,954 | $62,772 | $117,182 |
| 2022 | $2,890 | $176,427 | $61,542 | $114,885 |
| 2021 | $2,825 | $172,969 | $60,336 | $112,633 |
| 2020 | $2,824 | $171,197 | $59,718 | $111,479 |
| 2019 | $2,725 | $167,842 | $58,548 | $109,294 |
| 2018 | $2,543 | $164,551 | $57,400 | $107,151 |
| 2017 | $2,417 | $161,325 | $56,275 | $105,050 |
| 2016 | $1,846 | $158,163 | $55,172 | $102,991 |
| 2015 | $1,823 | $155,788 | $54,344 | $101,444 |
| 2014 | $1,798 | $152,737 | $53,280 | $99,457 |
Source: Public Records
Map
Nearby Homes
- 124 Gregory Ln
- 136 Evergreen Way
- 155 White Pine Dr
- 223 Wedgewood Ct
- 272 Woodridge Dr
- 401 Avian Dr
- 103 Sandalwood Ct
- 118 Lytham Way
- 2500 Springs Rd Unit 121
- 2500 Springs Rd Unit 116
- 102 Avian Dr
- 453 Knights Cir
- 121 Jackson Way
- 367 Darley Dr
- 1290 Rachel Way
- N/A N A
- 2512 Tennessee St
- 129 Foster St
- 841 Knights Cir
- 930 Brookwood Ave
- 115 Lora Ct
- 108 Lora Ct
- 109 Lora Ct
- 102 Lora Ct
- 103 Lora Ct
- 300 Locust Dr Unit 22
- 300 Locust Dr Unit 21
- 300 Locust Dr Unit 34
- 300 Locust Dr Unit 32
- 300 Locust Dr Unit 31
- 300 Locust Dr Unit 30
- 300 Locust Dr Unit 27
- 300 Locust Dr Unit 28
- 300 Locust Dr Unit 29
- 300 Locust Dr Unit 26
- 300 Locust Dr Unit 25
- 300 Locust Dr Unit 23
- 300 Locust Dr Unit 20
Your Personal Tour Guide
Ask me questions while you tour the home.