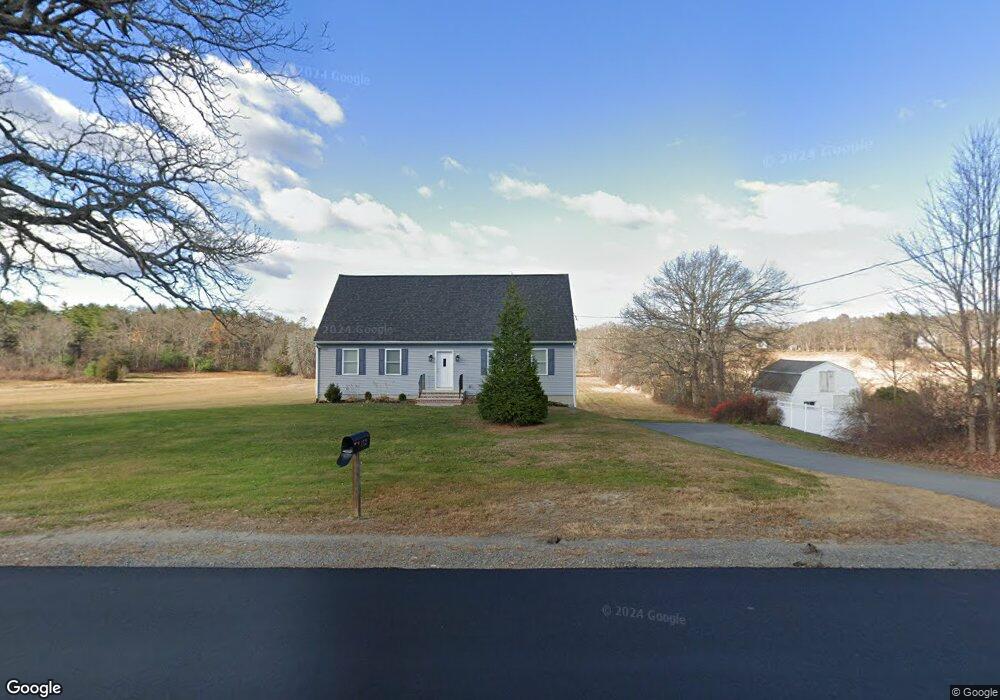
112 Main St Salisbury, MA 01952
Estimated Value: $669,098 - $717,000
3
Beds
2
Baths
1,872
Sq Ft
$370/Sq Ft
Est. Value
About This Home
This home is located at 112 Main St, Salisbury, MA 01952 and is currently estimated at $692,775, approximately $370 per square foot. 112 Main St is a home located in Essex County with nearby schools including Triton Regional High School and Amesbury Seventh-Day Adventist School.
Ownership History
Date
Name
Owned For
Owner Type
Purchase Details
Closed on
Sep 16, 2011
Sold by
Tindle Robert F and Tindle Joanne T
Bought by
112 Main St Rt
Current Estimated Value
Purchase Details
Closed on
Jun 29, 2011
Sold by
Tindle Jonathan M and Tindle Kelly A
Bought by
Tindle Robert F and Tindle Joanne T
Purchase Details
Closed on
Jul 11, 2008
Sold by
Tindle Jonathan M
Bought by
Tindle Jonathan M
Home Financials for this Owner
Home Financials are based on the most recent Mortgage that was taken out on this home.
Original Mortgage
$225,000
Interest Rate
6.13%
Mortgage Type
Purchase Money Mortgage
Create a Home Valuation Report for This Property
The Home Valuation Report is an in-depth analysis detailing your home's value as well as a comparison with similar homes in the area
Home Values in the Area
Average Home Value in this Area
Purchase History
| Date | Buyer | Sale Price | Title Company |
|---|---|---|---|
| 112 Main St Rt | -- | -- | |
| Tindle Robert F | $218,000 | -- | |
| Tindle Jonathan M | -- | -- |
Source: Public Records
Mortgage History
| Date | Status | Borrower | Loan Amount |
|---|---|---|---|
| Open | Tindle Jonathan M | $200,000 | |
| Previous Owner | Tindle Jonathan M | $225,000 |
Source: Public Records
Tax History
| Year | Tax Paid | Tax Assessment Tax Assessment Total Assessment is a certain percentage of the fair market value that is determined by local assessors to be the total taxable value of land and additions on the property. | Land | Improvement |
|---|---|---|---|---|
| 2025 | $5,086 | $504,600 | $167,800 | $336,800 |
| 2024 | $4,965 | $475,100 | $167,800 | $307,300 |
| 2023 | $2,980 | $445,900 | $167,800 | $278,100 |
| 2022 | $2,904 | $411,300 | $152,600 | $258,700 |
| 2021 | $2,935 | $399,200 | $152,600 | $246,600 |
| 2020 | $4,028 | $351,500 | $152,600 | $198,900 |
| 2019 | $2,539 | $339,600 | $152,600 | $187,000 |
| 2018 | $2,522 | $337,400 | $152,600 | $184,800 |
| 2017 | $2,292 | $301,100 | $130,800 | $170,300 |
| 2016 | $3,437 | $294,500 | $124,200 | $170,300 |
| 2015 | $3,429 | $291,800 | $124,200 | $167,600 |
Source: Public Records
Map
Nearby Homes
- 82 Monroe St
- 53 Rabbit Rd
- 9 Elmwood St
- 7 Toll Rd
- 25 Bayberry Ln
- 57 Baker Rd
- 21 Congress St
- 188 Lafayette Rd
- 154 Lafayette Rd
- 241 & 245 Lafayette Rd
- 97 Elm St
- 25 Cedar St Unit 4
- 5 Russell St Unit 1
- 191 Elm St
- 149 Market St
- 105 Market St Unit B
- 101 Market St Unit B
- 3 Birchwood Point Unit 202
- 4 Clark St
- 7 Birchwood Pointe Unit 101
Your Personal Tour Guide
Ask me questions while you tour the home.