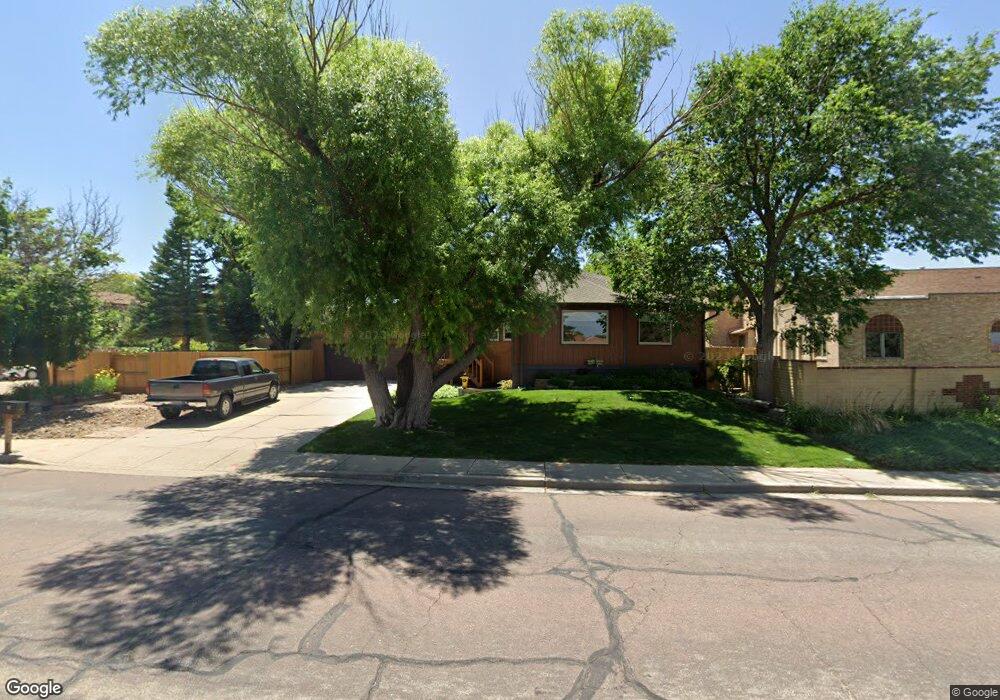
112 Montebello Rd Pueblo, CO 81001
Belmont NeighborhoodEstimated Value: $323,861 - $387,000
3
Beds
2
Baths
2,431
Sq Ft
$148/Sq Ft
Est. Value
About This Home
This home is located at 112 Montebello Rd, Pueblo, CO 81001 and is currently estimated at $358,715, approximately $147 per square foot. 112 Montebello Rd is a home located in Pueblo County with nearby schools including Belmont Elementary School, Heaton Middle School, and East High School.
Ownership History
Date
Name
Owned For
Owner Type
Purchase Details
Closed on
Nov 19, 2019
Sold by
Robinson Michell C and Robinson Mary
Bought by
Robinson Mary
Current Estimated Value
Purchase Details
Closed on
May 24, 1993
Sold by
Rayburn Wayne A + Caroline
Bought by
Robinson and Bailey
Purchase Details
Closed on
Jan 28, 1993
Sold by
Robinson and Bailey
Bought by
Robinson Mc and Robinson Bailey M
Purchase Details
Closed on
Jul 24, 1983
Sold by
Rayburn Wayne A
Bought by
Rayburn Wayne A + Caroline
Purchase Details
Closed on
Feb 7, 1983
Sold by
Intrawest Bank Of Pueblo Na
Bought by
Rayburn Wayne A
Purchase Details
Closed on
Jan 24, 1983
Sold by
Stone Gerald A
Bought by
Intrawest Bank Of Pueblo Na
Purchase Details
Closed on
Sep 11, 1981
Sold by
Chc Inc
Bought by
Stone Gerald A
Purchase Details
Closed on
Jan 16, 1981
Sold by
Eagan William T + Dixie Lee
Bought by
Chc Inc
Purchase Details
Closed on
Aug 24, 1979
Sold by
El Chico Investors Inc
Bought by
Eagan William T + Dixie Lee
Create a Home Valuation Report for This Property
The Home Valuation Report is an in-depth analysis detailing your home's value as well as a comparison with similar homes in the area
Home Values in the Area
Average Home Value in this Area
Purchase History
| Date | Buyer | Sale Price | Title Company |
|---|---|---|---|
| Robinson Mary | -- | None Available | |
| Robinson | $46,000 | -- | |
| Robinson Mc | $46,000 | -- | |
| Rayburn Wayne A + Caroline | -- | -- | |
| Rayburn Wayne A | $84,000 | -- | |
| Intrawest Bank Of Pueblo Na | -- | -- | |
| Stone Gerald A | -- | -- | |
| Chc Inc | $13,800 | -- | |
| Eagan William T + Dixie Lee | $14,300 | -- |
Source: Public Records
Tax History Compared to Growth
Tax History
| Year | Tax Paid | Tax Assessment Tax Assessment Total Assessment is a certain percentage of the fair market value that is determined by local assessors to be the total taxable value of land and additions on the property. | Land | Improvement |
|---|---|---|---|---|
| 2024 | $1,100 | $17,760 | -- | -- |
| 2023 | $1,111 | $21,450 | $1,680 | $19,770 |
| 2022 | $1,098 | $17,880 | $1,740 | $16,140 |
| 2021 | $1,132 | $18,390 | $1,790 | $16,600 |
| 2020 | $983 | $18,390 | $1,790 | $16,600 |
| 2019 | $983 | $16,753 | $1,502 | $15,251 |
| 2018 | $700 | $14,774 | $1,512 | $13,262 |
| 2017 | $707 | $14,774 | $1,512 | $13,262 |
| 2016 | $1,245 | $13,699 | $1,672 | $12,027 |
| 2015 | $1,240 | $13,699 | $1,672 | $12,027 |
| 2014 | $1,189 | $13,109 | $1,672 | $11,437 |
Source: Public Records
Map
Nearby Homes
- 136 Douglas Ln
- 13 Ironbridge Ln
- 146 Douglas Ln
- 6 Pineridge Ct
- 55 Bonnymede Rd Unit S
- 55 Bonnymede Rd
- 6 Crownbridge Ct
- 39 Apollo Ln
- 146 Montebello Rd
- 2 Hilton Ln
- 130 Scotland Rd Unit D
- 2 Alan Shepard Rd Unit 8
- 172 Bonnymede Rd
- 172 Bonnymede Rd Unit A
- 172 Bonnymede Rd Unit C
- 1 Mayweed Ct
- 1918 Cuchara Dr
- 5 Douglas Ln
- 4230 Blueflax Dr
- 27 Terrace Dr
- 3 Rusticbridge Ln Unit B
- 18 Cuesta Place
- 16 Cuesta Place
- 7 Rusticbridge Ln Unit B
- 7 Rusticbridge Ln Unit A
- 7 Rusticbridge Ln Unit A & B
- 14 Cuesta Place
- 116 Montebello Rd
- 4 Rusticbridge Ln
- 12 Cuesta Place
- 9 Rusticbridge Ln Unit B
- 9 Rusticbridge Ln Unit A
- 6 Rusticbridge Ln
- 10 Cuesta Place
- 8 Rusticbridge Ln Unit B
- 1 Ironbridge Ln
- 3 Ironbridge Ln
- 8 Cuesta Place
- 5 Ironbridge Ln
- 11 Rusticbridge Ln