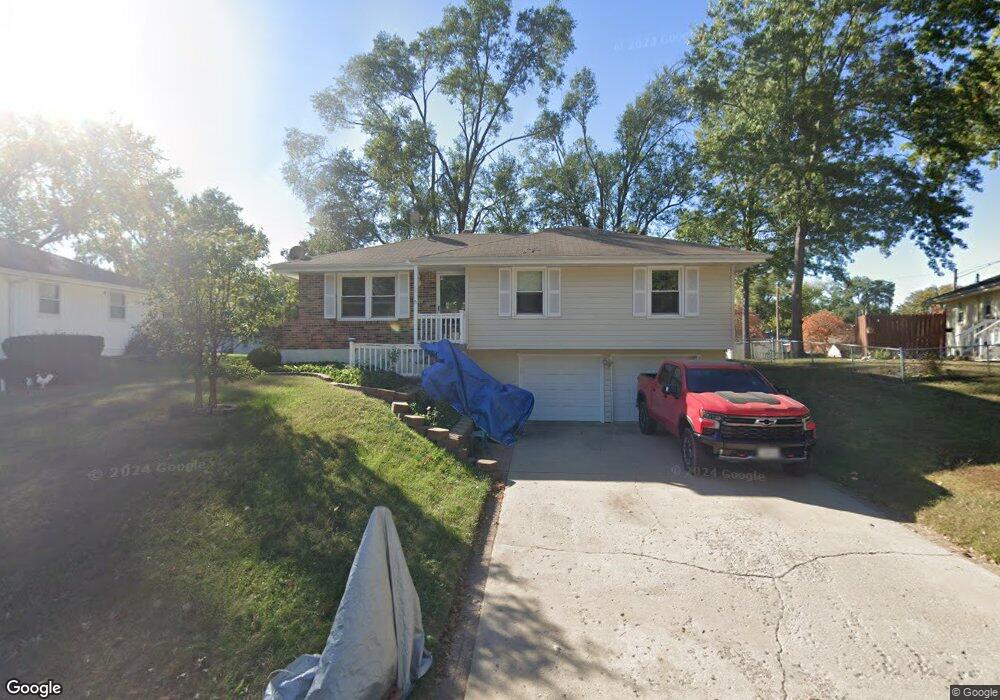
112 N Lee St Buckner, MO 64016
Estimated Value: $199,407 - $219,000
3
Beds
1
Bath
1,058
Sq Ft
$200/Sq Ft
Est. Value
About This Home
This home is located at 112 N Lee St, Buckner, MO 64016 and is currently estimated at $211,352, approximately $199 per square foot. 112 N Lee St is a home located in Jackson County with nearby schools including Fort Osage High School.
Ownership History
Date
Name
Owned For
Owner Type
Purchase Details
Closed on
May 20, 1998
Sold by
Pottberg Steven R and Pottberg Elaine A
Bought by
Brown Angela Susan
Current Estimated Value
Home Financials for this Owner
Home Financials are based on the most recent Mortgage that was taken out on this home.
Original Mortgage
$67,822
Outstanding Balance
$13,264
Interest Rate
7.11%
Mortgage Type
FHA
Estimated Equity
$198,088
Purchase Details
Closed on
May 14, 1996
Sold by
Pottberg Staci D
Bought by
Pottberg Steven R
Create a Home Valuation Report for This Property
The Home Valuation Report is an in-depth analysis detailing your home's value as well as a comparison with similar homes in the area
Home Values in the Area
Average Home Value in this Area
Purchase History
| Date | Buyer | Sale Price | Title Company |
|---|---|---|---|
| Brown Angela Susan | -- | Stewart Title | |
| Pottberg Steven R | -- | -- |
Source: Public Records
Mortgage History
| Date | Status | Borrower | Loan Amount |
|---|---|---|---|
| Open | Brown Angela Susan | $67,822 |
Source: Public Records
Tax History
| Year | Tax Paid | Tax Assessment Tax Assessment Total Assessment is a certain percentage of the fair market value that is determined by local assessors to be the total taxable value of land and additions on the property. | Land | Improvement |
|---|---|---|---|---|
| 2025 | $2,447 | $25,629 | $4,385 | $21,244 |
| 2024 | $2,423 | $26,040 | $3,678 | $22,362 |
| 2023 | $2,423 | $26,040 | $3,481 | $22,559 |
| 2022 | $1,911 | $19,380 | $3,116 | $16,264 |
| 2021 | $1,913 | $19,380 | $3,116 | $16,264 |
| 2020 | $1,768 | $17,587 | $3,116 | $14,471 |
| 2019 | $1,731 | $17,587 | $3,116 | $14,471 |
| 2018 | $1,605 | $16,128 | $2,993 | $13,135 |
| 2016 | $1,457 | $15,751 | $3,173 | $12,578 |
Source: Public Records
Map
Nearby Homes
- 102 Cliff Dr
- 200 Erin St
- 410 Park Ave
- 300 Hazel St
- 707 Tall Chief St
- 710 Elliott St
- 814 N Buckner Tarsney Rd
- 416 N Buckner Tarsney Rd
- 709 Lake City Buckner Rd
- 414 S Borgman Rd
- 27511 E Blue Mills Rd
- 35407 E Little Rd
- 917 N Washboard Rd
- 0 N Bogart Rd
- 1515 S Buckner Tarsney (Bb) Rd
- 1509 S Buckner Tarsney Rd
- 1521 S Buckner Tarsney Rd
- 1515 S Buckner Tarsney Rd
- 1505 S Buckner Tarsney Rd
- 26103 E Blue Mills Rd
Your Personal Tour Guide
Ask me questions while you tour the home.