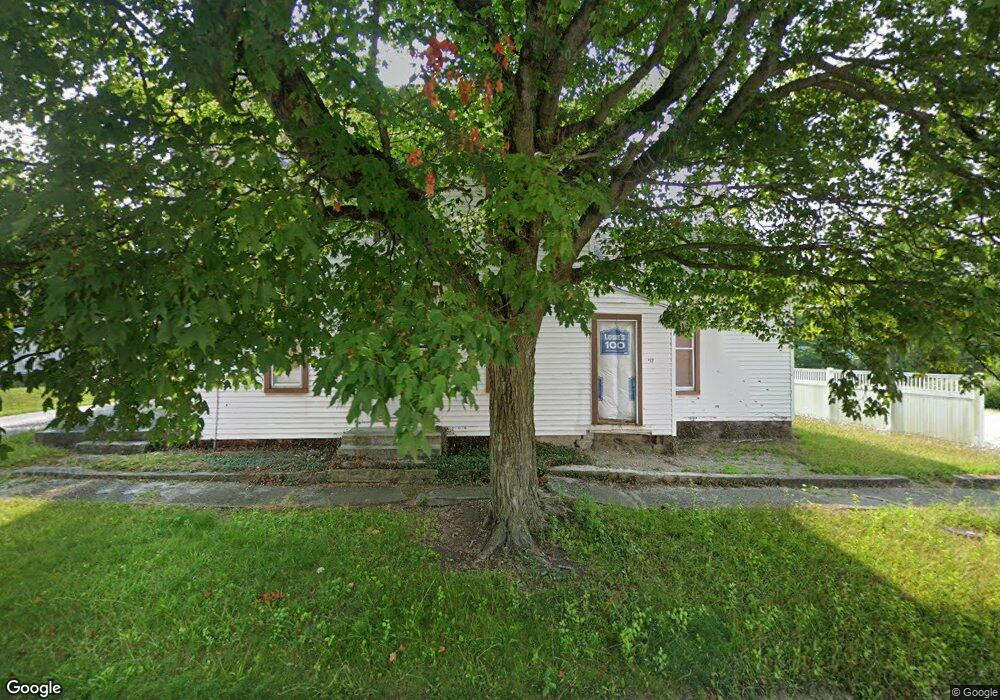
112 N Main St Warren, IN 46792
Estimated Value: $168,000 - $184,562
5
Beds
2
Baths
2,230
Sq Ft
$79/Sq Ft
Est. Value
About This Home
This home is located at 112 N Main St, Warren, IN 46792 and is currently estimated at $176,891, approximately $79 per square foot. 112 N Main St is a home with nearby schools including Salamonie School and Huntington North High School.
Ownership History
Date
Name
Owned For
Owner Type
Purchase Details
Closed on
May 9, 2024
Sold by
Frettinger Jon and Frettinger Lori
Bought by
Salt And Light Properties Llc
Current Estimated Value
Home Financials for this Owner
Home Financials are based on the most recent Mortgage that was taken out on this home.
Original Mortgage
$167,000
Outstanding Balance
$160,057
Interest Rate
6.79%
Mortgage Type
New Conventional
Estimated Equity
$16,834
Create a Home Valuation Report for This Property
The Home Valuation Report is an in-depth analysis detailing your home's value as well as a comparison with similar homes in the area
Purchase History
| Date | Buyer | Sale Price | Title Company |
|---|---|---|---|
| Salt And Light Properties Llc | $20,000 | Fidelity National Title | |
| Frettinger Jon | $20,000 | Fidelity National Title |
Source: Public Records
Mortgage History
| Date | Status | Borrower | Loan Amount |
|---|---|---|---|
| Open | Frettinger Jon | $167,000 |
Source: Public Records
Tax History
| Year | Tax Paid | Tax Assessment Tax Assessment Total Assessment is a certain percentage of the fair market value that is determined by local assessors to be the total taxable value of land and additions on the property. | Land | Improvement |
|---|---|---|---|---|
| 2024 | $2,526 | $126,300 | $11,600 | $114,700 |
| 2023 | $2,142 | $107,100 | $11,600 | $95,500 |
| 2022 | $1,948 | $97,400 | $11,600 | $85,800 |
| 2021 | $1,794 | $89,700 | $11,600 | $78,100 |
| 2020 | $743 | $89,700 | $11,600 | $78,100 |
| 2019 | $640 | $81,400 | $11,600 | $69,800 |
| 2018 | $1,552 | $77,600 | $11,600 | $66,000 |
| 2017 | $1,544 | $77,200 | $11,600 | $65,600 |
| 2016 | $1,634 | $81,600 | $11,600 | $70,000 |
| 2014 | $1,570 | $78,400 | $11,600 | $66,800 |
| 2013 | $1,570 | $76,000 | $11,600 | $64,400 |
Source: Public Records
Map
Nearby Homes
- 123 W 1st St
- 412 N Nancy St
- 212 N Hendricks St
- 203 E 8th St
- 619 E 6th St
- 11899 S Hartford City Rd
- I 69 E 700 N
- 9964 E 400 N
- 201 E Vine St
- 603 W Main St
- 8539 W 1000 S-90
- 8885 E 400 N
- 6420 S 400 W
- 2384 S 400 W
- 11757 E 1000 S-27
- 2804 N 800 E
- 6213 S 594 W
- 4015 N 600 E
- 0183 W State Road 18
- 9814 S Cr 200 W
Your Personal Tour Guide
Ask me questions while you tour the home.