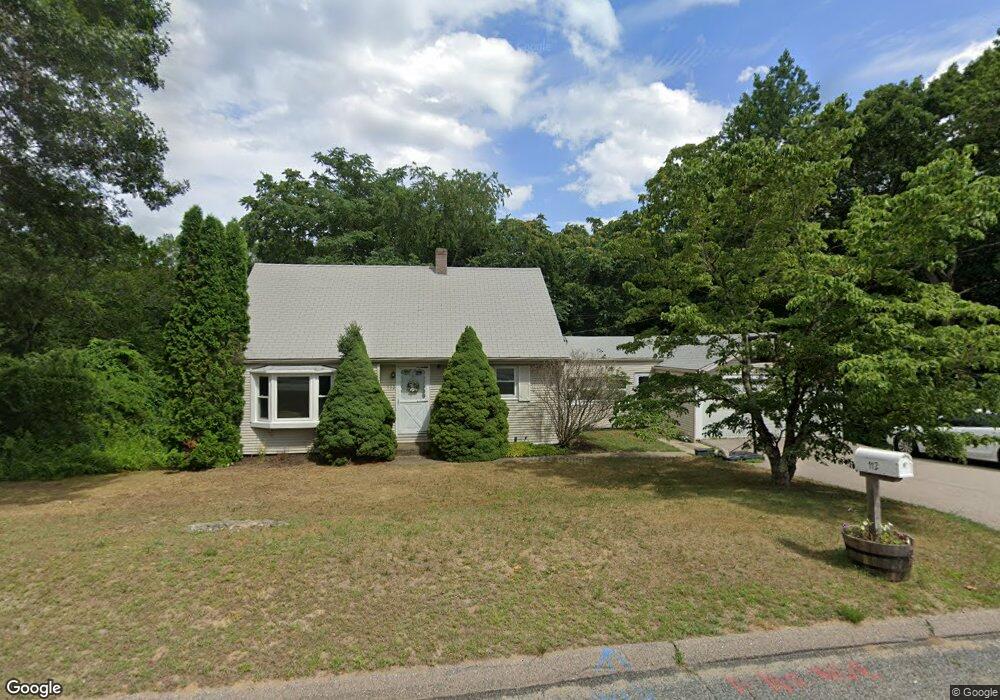
112 Oak St Foxboro, MA 02035
Estimated Value: $568,651 - $623,000
3
Beds
2
Baths
1,683
Sq Ft
$356/Sq Ft
Est. Value
About This Home
This home is located at 112 Oak St, Foxboro, MA 02035 and is currently estimated at $599,163, approximately $356 per square foot. 112 Oak St is a home located in Norfolk County with nearby schools including Foxborough High School, Foxborough Regional Charter School, and The Sage School.
Ownership History
Date
Name
Owned For
Owner Type
Purchase Details
Closed on
Mar 16, 2022
Sold by
Conway James Est
Bought by
Roberts Shauna
Current Estimated Value
Purchase Details
Closed on
May 17, 2011
Sold by
Fleet Prop Solutions L
Bought by
Manning Shauna L and Manning Michael
Home Financials for this Owner
Home Financials are based on the most recent Mortgage that was taken out on this home.
Original Mortgage
$307,014
Interest Rate
4.88%
Mortgage Type
Purchase Money Mortgage
Purchase Details
Closed on
Dec 13, 2010
Sold by
Hatfield Burnice M and Hatfield Charles S
Bought by
Fleet Property Solut L
Create a Home Valuation Report for This Property
The Home Valuation Report is an in-depth analysis detailing your home's value as well as a comparison with similar homes in the area
Home Values in the Area
Average Home Value in this Area
Purchase History
| Date | Buyer | Sale Price | Title Company |
|---|---|---|---|
| Roberts Shauna | -- | None Available | |
| Manning Shauna L | $315,000 | -- | |
| Fleet Property Solut L | $190,000 | -- |
Source: Public Records
Mortgage History
| Date | Status | Borrower | Loan Amount |
|---|---|---|---|
| Previous Owner | Manning Shauna L | $307,014 |
Source: Public Records
Tax History
| Year | Tax Paid | Tax Assessment Tax Assessment Total Assessment is a certain percentage of the fair market value that is determined by local assessors to be the total taxable value of land and additions on the property. | Land | Improvement |
|---|---|---|---|---|
| 2025 | $6,023 | $455,600 | $184,600 | $271,000 |
| 2024 | $5,957 | $440,900 | $198,900 | $242,000 |
| 2023 | $5,795 | $407,800 | $189,500 | $218,300 |
| 2022 | $5,592 | $385,100 | $169,800 | $215,300 |
| 2021 | $5,383 | $365,200 | $161,300 | $203,900 |
| 2020 | $5,204 | $357,200 | $161,300 | $195,900 |
| 2019 | $5,067 | $344,700 | $161,800 | $182,900 |
| 2018 | $4,858 | $333,400 | $153,700 | $179,700 |
| 2017 | $4,685 | $311,500 | $151,200 | $160,300 |
| 2016 | $4,679 | $315,700 | $145,400 | $170,300 |
| 2015 | $4,232 | $278,600 | $108,300 | $170,300 |
| 2014 | $4,176 | $278,600 | $108,300 | $170,300 |
Source: Public Records
Map
Nearby Homes
- 1 Maura Elizabeth Ln
- 9 Independence Dr Unit 9
- 165 Chestnut St Unit 2
- 147 Chestnut St Unit A
- 147 Chestnut St Unit B
- 2 Foxfire Dr
- 668 S Main St
- 3 Wampanoag Rd
- 26 Fuller Rd Unit 6
- 13 Summerville Rd Unit 13
- 73 Ridge Rd
- 180 Old Post Rd Unit 202
- 180 Old Post Rd Unit 206
- 180 Old Post Rd Unit 308
- 180 Old Post Rd Unit 201
- 180 Old Post Rd Unit 405
- 180 Old Post Rd Unit 207
- 3 Willow St
- 14 Baker St
- 120 Beach St
Your Personal Tour Guide
Ask me questions while you tour the home.