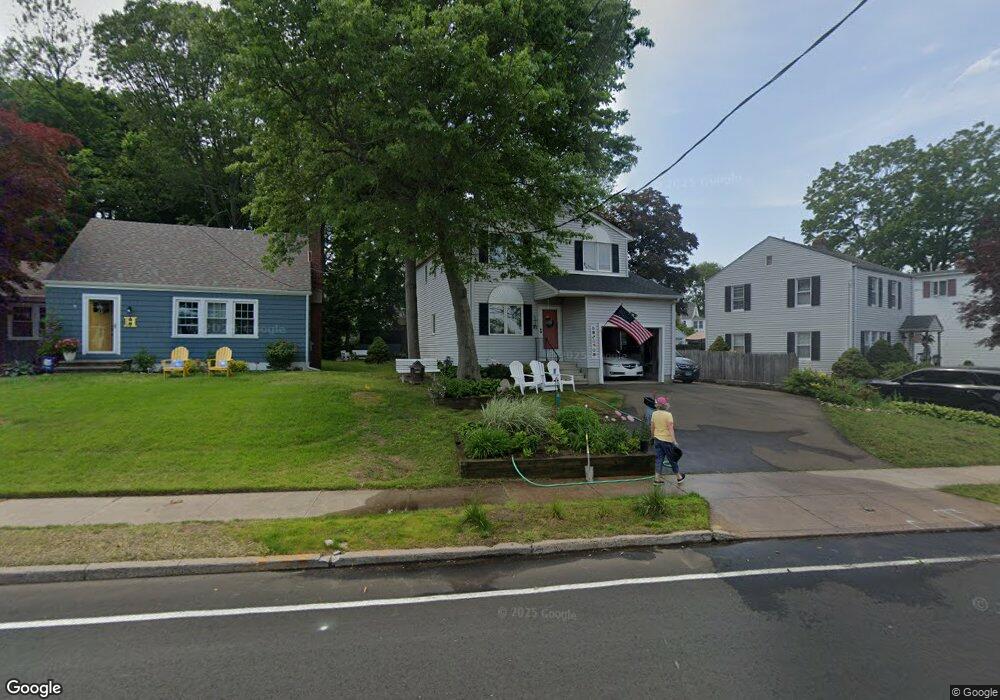
112 Platt Ave West Haven, CT 06516
West Shore NeighborhoodEstimated Value: $432,000 - $475,000
3
Beds
3
Baths
1,492
Sq Ft
$304/Sq Ft
Est. Value
About This Home
This home is located at 112 Platt Ave, West Haven, CT 06516 and is currently estimated at $453,862, approximately $304 per square foot. 112 Platt Ave is a home located in New Haven County with nearby schools including Carrigan 5/6 Intermediate School, Harry M. Bailey Middle School, and West Haven High School.
Ownership History
Date
Name
Owned For
Owner Type
Purchase Details
Closed on
Jun 2, 2020
Sold by
Radovich Evanica
Bought by
Calandro Elisabeth
Current Estimated Value
Home Financials for this Owner
Home Financials are based on the most recent Mortgage that was taken out on this home.
Original Mortgage
$245,471
Outstanding Balance
$217,110
Interest Rate
3.2%
Mortgage Type
FHA
Estimated Equity
$236,752
Create a Home Valuation Report for This Property
The Home Valuation Report is an in-depth analysis detailing your home's value as well as a comparison with similar homes in the area
Home Values in the Area
Average Home Value in this Area
Purchase History
| Date | Buyer | Sale Price | Title Company |
|---|---|---|---|
| Calandro Elisabeth | $250,000 | None Available | |
| Calandro Elisabeth | $250,000 | None Available |
Source: Public Records
Mortgage History
| Date | Status | Borrower | Loan Amount |
|---|---|---|---|
| Open | Calandro Elisabeth | $245,471 | |
| Closed | Calandro Elisabeth | $245,471 |
Source: Public Records
Tax History Compared to Growth
Tax History
| Year | Tax Paid | Tax Assessment Tax Assessment Total Assessment is a certain percentage of the fair market value that is determined by local assessors to be the total taxable value of land and additions on the property. | Land | Improvement |
|---|---|---|---|---|
| 2025 | $9,029 | $274,680 | $80,780 | $193,900 |
| 2024 | $8,223 | $175,490 | $55,930 | $119,560 |
| 2023 | $7,915 | $175,490 | $55,930 | $119,560 |
| 2022 | $7,772 | $175,490 | $55,930 | $119,560 |
| 2021 | $1,540 | $175,490 | $55,930 | $119,560 |
| 2020 | $7,809 | $160,650 | $51,030 | $109,620 |
| 2019 | $1,517 | $160,650 | $51,030 | $109,620 |
| 2018 | $7,453 | $160,650 | $51,030 | $109,620 |
| 2017 | $7,252 | $160,650 | $51,030 | $109,620 |
| 2016 | $7,171 | $160,650 | $51,030 | $109,620 |
| 2015 | $6,747 | $169,190 | $56,840 | $112,350 |
| 2014 | $6,747 | $169,190 | $56,840 | $112,350 |
Source: Public Records
Map
Nearby Homes