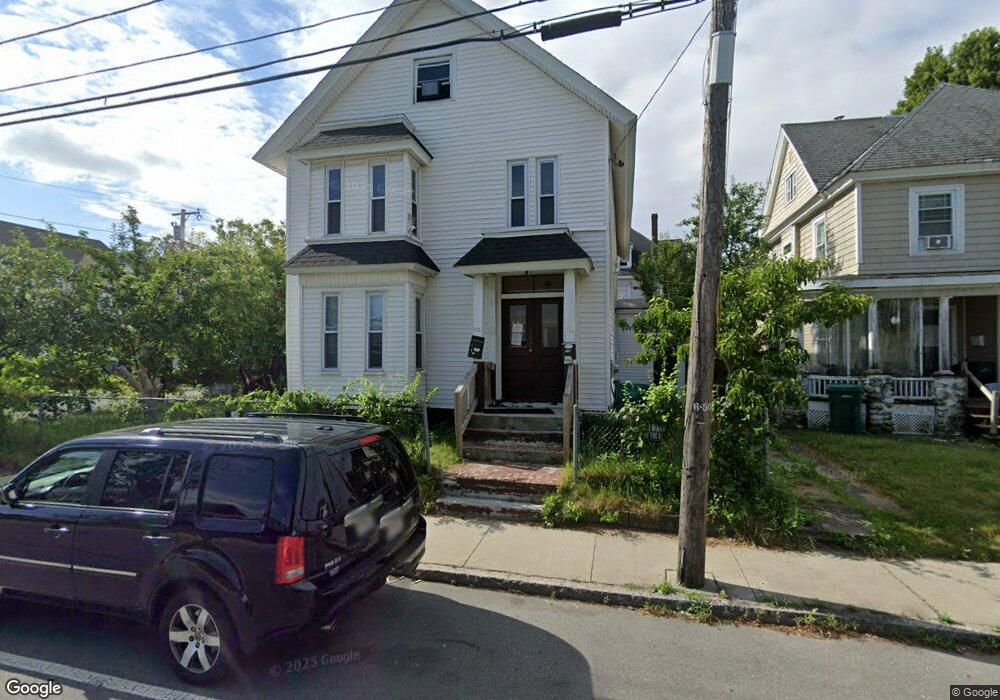
112 Princeton Blvd Lowell, MA 01851
Highlands NeighborhoodEstimated Value: $641,230 - $790,000
5
Beds
2
Baths
2,840
Sq Ft
$256/Sq Ft
Est. Value
About This Home
This home is located at 112 Princeton Blvd, Lowell, MA 01851 and is currently estimated at $728,058, approximately $256 per square foot. 112 Princeton Blvd is a home located in Middlesex County with nearby schools including Charles W. Morey Elementary School, Abraham Lincoln Elementary School, and Dr. Gertrude Bailey Elementary School.
Ownership History
Date
Name
Owned For
Owner Type
Purchase Details
Closed on
Feb 20, 2019
Sold by
Vann Channa and Vann Channy
Bought by
Im-Sovannary Lisa
Current Estimated Value
Home Financials for this Owner
Home Financials are based on the most recent Mortgage that was taken out on this home.
Original Mortgage
$208,000
Outstanding Balance
$182,496
Interest Rate
4.4%
Mortgage Type
New Conventional
Estimated Equity
$545,562
Purchase Details
Closed on
Nov 29, 2002
Sold by
Seng Kimpisey and Seng Timothy Lee
Bought by
Vann Channa and Vann Channy
Home Financials for this Owner
Home Financials are based on the most recent Mortgage that was taken out on this home.
Original Mortgage
$274,659
Interest Rate
6.16%
Mortgage Type
Purchase Money Mortgage
Purchase Details
Closed on
Mar 28, 2000
Sold by
Lapointe Jeffrey P
Bought by
Seng Timothy Lee
Purchase Details
Closed on
Aug 30, 1996
Sold by
Brown Edward A and Brown Nancy
Bought by
Lapointe Jeffrey P
Create a Home Valuation Report for This Property
The Home Valuation Report is an in-depth analysis detailing your home's value as well as a comparison with similar homes in the area
Home Values in the Area
Average Home Value in this Area
Purchase History
| Date | Buyer | Sale Price | Title Company |
|---|---|---|---|
| Im-Sovannary Lisa | $260,000 | -- | |
| Vann Channa | $285,000 | -- | |
| Vann Channa | $285,000 | -- | |
| Seng Timothy Lee | $139,000 | -- | |
| Seng Timothy Lee | $139,000 | -- | |
| Lapointe Jeffrey P | $93,000 | -- | |
| Lapointe Jeffrey P | $93,000 | -- |
Source: Public Records
Mortgage History
| Date | Status | Borrower | Loan Amount |
|---|---|---|---|
| Open | Im-Sovannary Lisa | $208,000 | |
| Previous Owner | Lapointe Jeffrey P | $274,659 | |
| Previous Owner | Lapointe Jeffrey P | $132,000 |
Source: Public Records
Tax History Compared to Growth
Tax History
| Year | Tax Paid | Tax Assessment Tax Assessment Total Assessment is a certain percentage of the fair market value that is determined by local assessors to be the total taxable value of land and additions on the property. | Land | Improvement |
|---|---|---|---|---|
| 2025 | $6,730 | $586,200 | $156,300 | $429,900 |
| 2024 | $6,284 | $527,600 | $147,400 | $380,200 |
| 2023 | $5,839 | $470,100 | $128,200 | $341,900 |
| 2022 | $5,406 | $426,000 | $116,600 | $309,400 |
| 2021 | $5,014 | $372,500 | $101,400 | $271,100 |
| 2020 | $4,621 | $345,900 | $95,900 | $250,000 |
| 2019 | $4,351 | $309,900 | $93,000 | $216,900 |
| 2018 | $3,740 | $283,000 | $88,600 | $194,400 |
| 2017 | $3,742 | $250,800 | $73,200 | $177,600 |
| 2016 | $3,720 | $245,400 | $69,700 | $175,700 |
| 2015 | $3,455 | $223,200 | $69,700 | $153,500 |
| 2013 | $3,188 | $212,400 | $81,500 | $130,900 |
Source: Public Records
Map
Nearby Homes
- 18 Edson St
- 90 Belmont St
- 30 Livingston Ave
- 312 Wilder St
- 1280 Middlesex St
- 17 Oakland St
- 337 Stevens St Unit D
- 1149 Middlesex St
- 1311 Middlesex St
- 15 Sayles St
- 11 Columbus Ave
- 41 Coral St
- 613 School St
- 997 Middlesex St Unit 2
- 984 Middlesex St
- 987 Middlesex St
- 85 B St
- 21 Kimball Ave
- 173 Westford St
- 42 Branch St
- 116 Princeton Blvd
- 30 Edson St
- 94 Princeton Blvd
- 20F Edson St Unit 20 F
- 20F Edson St
- 24 Edson St
- 24R Edson St Unit 24 R
- 22 Edson St
- 122 Princeton Blvd
- 21 Edson St
- 14 Edson St
- 17 Edson St
- 136 Princeton Blvd
- 133 Princeton Blvd
- 161 Stevens St
- 26 Chester St
- 26 Chester St
- 541 Westford St
- 549 Westford St Unit 3
- 549 Westford St Unit 1