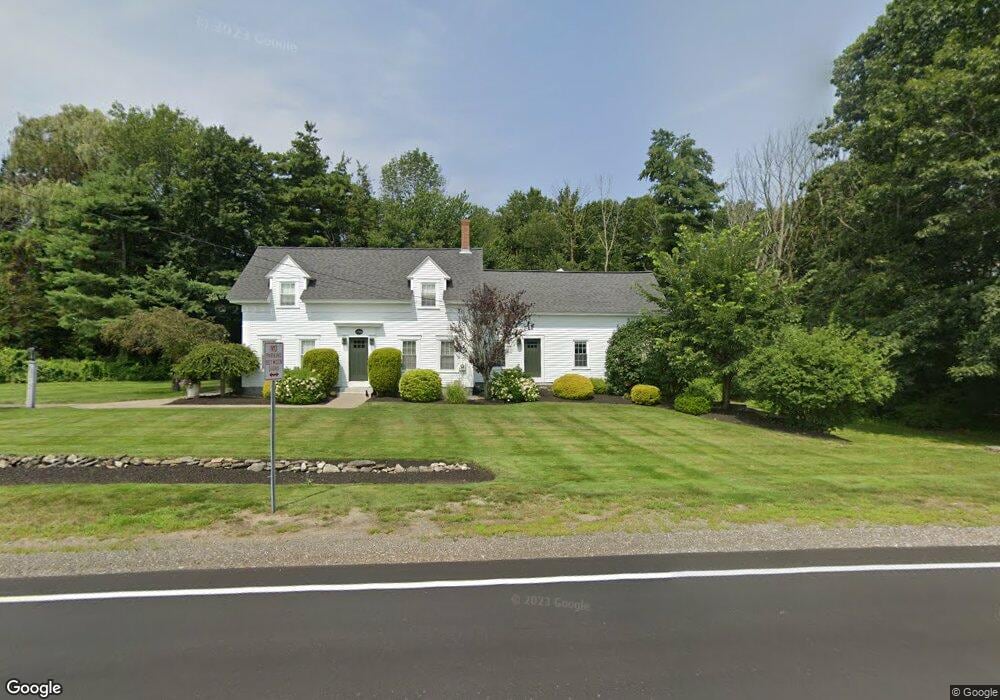
112 Range Rd Windham, NH 03087
Estimated Value: $670,985
3
Beds
2
Baths
2,151
Sq Ft
$312/Sq Ft
Est. Value
About This Home
This home is located at 112 Range Rd, Windham, NH 03087 and is currently estimated at $670,985, approximately $311 per square foot. 112 Range Rd is a home located in Rockingham County with nearby schools including Golden Brook Elementary School, Windham Middle School, and Windham High School.
Ownership History
Date
Name
Owned For
Owner Type
Purchase Details
Closed on
Sep 21, 2010
Sold by
T & K Range Road Llc
Bought by
Northstar On Range Llc
Current Estimated Value
Home Financials for this Owner
Home Financials are based on the most recent Mortgage that was taken out on this home.
Original Mortgage
$188,200
Outstanding Balance
$124,715
Interest Rate
4.51%
Mortgage Type
Purchase Money Mortgage
Estimated Equity
$546,270
Purchase Details
Closed on
Jul 21, 2005
Sold by
Driscoll William J
Bought by
T & K Range Rd Llc
Create a Home Valuation Report for This Property
The Home Valuation Report is an in-depth analysis detailing your home's value as well as a comparison with similar homes in the area
Home Values in the Area
Average Home Value in this Area
Purchase History
| Date | Buyer | Sale Price | Title Company |
|---|---|---|---|
| Northstar On Range Llc | $300,000 | -- | |
| T & K Range Rd Llc | $262,500 | -- |
Source: Public Records
Mortgage History
| Date | Status | Borrower | Loan Amount |
|---|---|---|---|
| Open | T & K Range Rd Llc | $188,200 | |
| Closed | T & K Range Rd Llc | $152,000 |
Source: Public Records
Tax History
| Year | Tax Paid | Tax Assessment Tax Assessment Total Assessment is a certain percentage of the fair market value that is determined by local assessors to be the total taxable value of land and additions on the property. | Land | Improvement |
|---|---|---|---|---|
| 2024 | $11,841 | $523,000 | $273,800 | $249,200 |
| 2023 | $11,192 | $523,000 | $273,800 | $249,200 |
| 2022 | $10,022 | $507,200 | $273,800 | $233,400 |
| 2021 | $9,444 | $507,200 | $273,800 | $233,400 |
| 2020 | $7,927 | $414,400 | $153,100 | $261,300 |
| 2019 | $7,385 | $327,500 | $140,300 | $187,200 |
| 2018 | $7,627 | $327,500 | $140,300 | $187,200 |
| 2017 | $6,616 | $327,500 | $140,300 | $187,200 |
| 2016 | $6,982 | $320,000 | $140,300 | $179,700 |
| 2015 | $5,927 | $272,900 | $140,300 | $132,600 |
| 2014 | $7,030 | $292,900 | $173,000 | $119,900 |
| 2013 | $7,085 | $300,200 | $173,000 | $127,200 |
Source: Public Records
Map
Nearby Homes
Your Personal Tour Guide
Ask me questions while you tour the home.