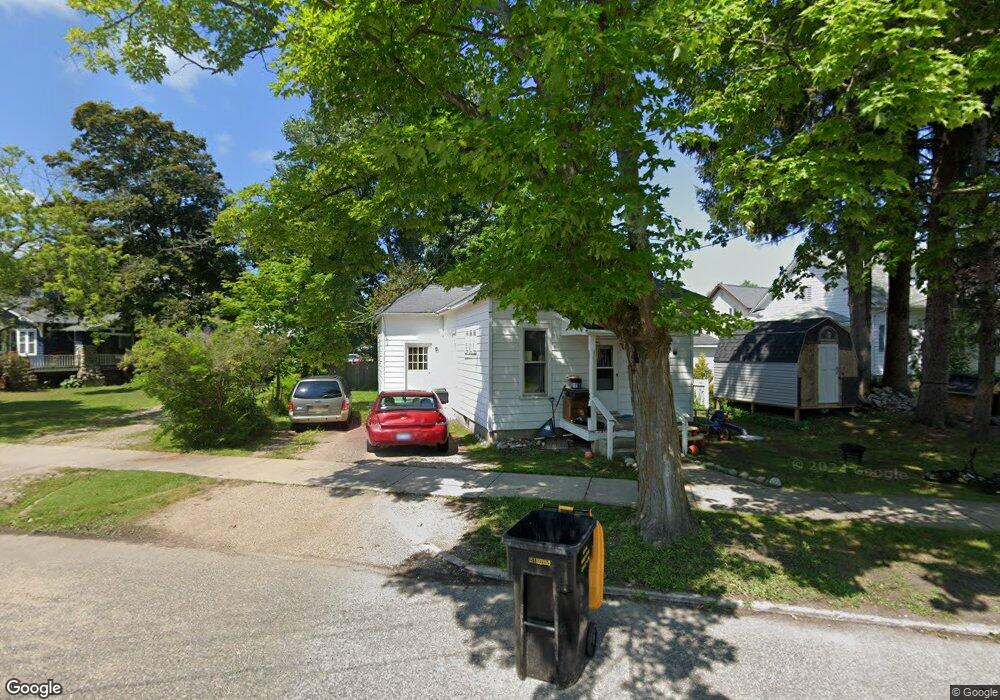
112 S Ball St Cheboygan, MI 49721
Estimated Value: $69,200 - $141,000
2
Beds
1
Bath
1,090
Sq Ft
$100/Sq Ft
Est. Value
About This Home
This home is located at 112 S Ball St, Cheboygan, MI 49721 and is currently estimated at $108,550, approximately $99 per square foot. 112 S Ball St is a home located in Cheboygan County with nearby schools including Cheboygan Intermediate School, East Elementary School, and Cheboygan Area High School.
Ownership History
Date
Name
Owned For
Owner Type
Purchase Details
Closed on
Aug 18, 2022
Sold by
Daniels Clayton
Bought by
Vanier Jaclynn M
Current Estimated Value
Home Financials for this Owner
Home Financials are based on the most recent Mortgage that was taken out on this home.
Original Mortgage
$32,500
Outstanding Balance
$31,079
Interest Rate
5.54%
Mortgage Type
New Conventional
Estimated Equity
$77,471
Purchase Details
Closed on
Aug 27, 2004
Bought by
Mcgovern Clayton and Mcgovern Vicki
Create a Home Valuation Report for This Property
The Home Valuation Report is an in-depth analysis detailing your home's value as well as a comparison with similar homes in the area
Home Values in the Area
Average Home Value in this Area
Purchase History
| Date | Buyer | Sale Price | Title Company |
|---|---|---|---|
| Vanier Jaclynn M | $47,455 | -- | |
| Mcgovern Clayton | $40,000 | -- |
Source: Public Records
Mortgage History
| Date | Status | Borrower | Loan Amount |
|---|---|---|---|
| Open | Vanier Jaclynn M | $32,500 |
Source: Public Records
Tax History Compared to Growth
Tax History
| Year | Tax Paid | Tax Assessment Tax Assessment Total Assessment is a certain percentage of the fair market value that is determined by local assessors to be the total taxable value of land and additions on the property. | Land | Improvement |
|---|---|---|---|---|
| 2025 | $968 | $36,700 | $0 | $0 |
| 2024 | $700 | $31,100 | $0 | $0 |
| 2023 | $673 | $27,000 | $0 | $0 |
| 2022 | $650 | $21,800 | $0 | $0 |
| 2021 | $836 | $20,800 | $20,800 | $0 |
| 2020 | $828 | $19,900 | $19,900 | $0 |
| 2019 | $1,131 | $19,000 | $19,000 | $0 |
| 2018 | $1,106 | $18,600 | $0 | $0 |
| 2017 | $1,113 | $18,400 | $0 | $0 |
| 2016 | $1,099 | $18,700 | $0 | $0 |
| 2015 | -- | $13,900 | $0 | $0 |
| 2014 | -- | $13,500 | $0 | $0 |
| 2012 | -- | $13,400 | $0 | $0 |
Source: Public Records
Map
Nearby Homes