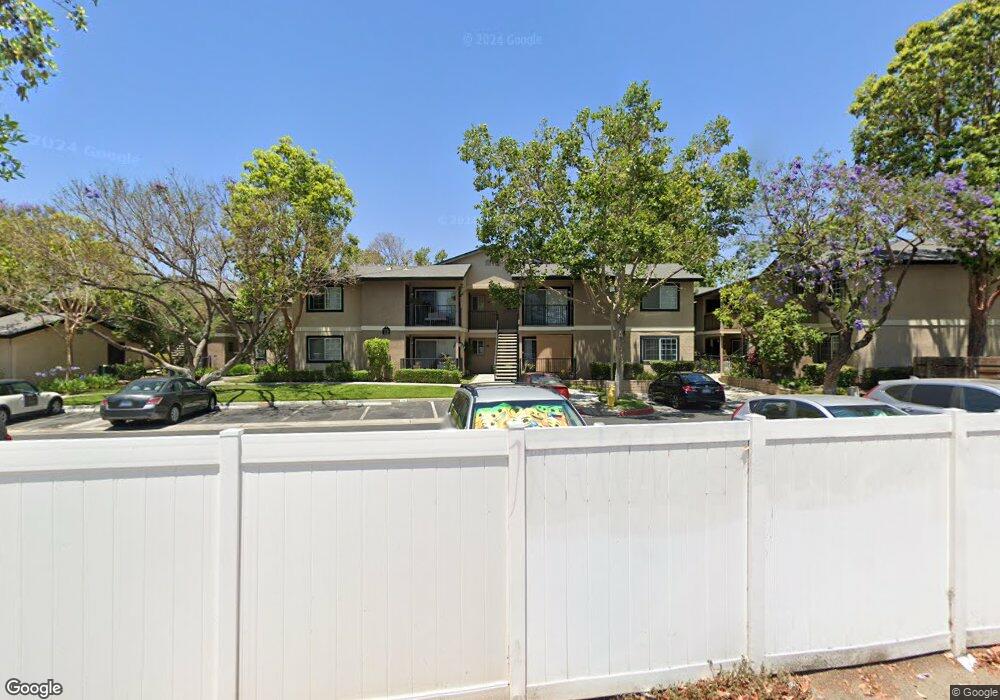
112 S Seneca Cir Unit 7 Anaheim, CA 92805
The Colony NeighborhoodEstimated Value: $623,000 - $656,000
2
Beds
3
Baths
1,346
Sq Ft
$476/Sq Ft
Est. Value
About This Home
This home is located at 112 S Seneca Cir Unit 7, Anaheim, CA 92805 and is currently estimated at $640,462, approximately $475 per square foot. 112 S Seneca Cir Unit 7 is a home located in Orange County with nearby schools including Benjamin Franklin Elementary School, Sycamore Junior High School, and Anaheim High School.
Ownership History
Date
Name
Owned For
Owner Type
Purchase Details
Closed on
Oct 17, 2011
Sold by
The Northern Trust Company
Bought by
Rhodes Traci
Current Estimated Value
Home Financials for this Owner
Home Financials are based on the most recent Mortgage that was taken out on this home.
Original Mortgage
$219,296
Outstanding Balance
$147,753
Interest Rate
3.85%
Mortgage Type
FHA
Estimated Equity
$492,709
Purchase Details
Closed on
Aug 6, 2001
Sold by
Lopez Terry
Bought by
Lopez Robyn L and Haar Robyn L
Home Financials for this Owner
Home Financials are based on the most recent Mortgage that was taken out on this home.
Original Mortgage
$132,000
Interest Rate
7.21%
Purchase Details
Closed on
Jul 27, 1999
Sold by
Howard Ofner and Howard Michele Ofner
Bought by
Haar Robyn L
Home Financials for this Owner
Home Financials are based on the most recent Mortgage that was taken out on this home.
Original Mortgage
$126,100
Interest Rate
7.37%
Create a Home Valuation Report for This Property
The Home Valuation Report is an in-depth analysis detailing your home's value as well as a comparison with similar homes in the area
Home Values in the Area
Average Home Value in this Area
Purchase History
| Date | Buyer | Sale Price | Title Company |
|---|---|---|---|
| Rhodes Traci | $225,000 | Stewart Title Of California | |
| Lopez Robyn L | -- | Fidelity National Title Ins | |
| Haar Robyn L | $130,000 | North American Title Co |
Source: Public Records
Mortgage History
| Date | Status | Borrower | Loan Amount |
|---|---|---|---|
| Open | Rhodes Traci | $219,296 | |
| Previous Owner | Lopez Robyn L | $132,000 | |
| Previous Owner | Haar Robyn L | $126,100 |
Source: Public Records
Tax History Compared to Growth
Tax History
| Year | Tax Paid | Tax Assessment Tax Assessment Total Assessment is a certain percentage of the fair market value that is determined by local assessors to be the total taxable value of land and additions on the property. | Land | Improvement |
|---|---|---|---|---|
| 2025 | $3,431 | $282,606 | $147,745 | $134,861 |
| 2024 | $3,431 | $277,065 | $144,848 | $132,217 |
| 2023 | $3,357 | $271,633 | $142,008 | $129,625 |
| 2022 | $3,312 | $266,307 | $139,223 | $127,084 |
| 2021 | $3,316 | $261,086 | $136,493 | $124,593 |
| 2020 | $3,302 | $258,409 | $135,093 | $123,316 |
| 2019 | $3,207 | $253,343 | $132,444 | $120,899 |
| 2018 | $3,142 | $248,376 | $129,847 | $118,529 |
| 2017 | $3,023 | $243,506 | $127,301 | $116,205 |
| 2016 | $3,013 | $238,732 | $124,805 | $113,927 |
| 2015 | $2,986 | $235,147 | $122,931 | $112,216 |
| 2014 | $2,807 | $230,541 | $120,523 | $110,018 |
Source: Public Records
Map
Nearby Homes
- 208 S Illinois St
- 435 W Center Street Promenade Unit 331
- 435 W Center Street Promenade Unit 401
- 435 W Center Street Promenade Unit 400
- 612 W Santa Ana St
- 405 N Janss St
- 523 S Citron St
- 1136 W Broadway
- 526 W Water St
- 917 W Alberta St
- 1235 W Pearl St
- 609 S Helena St
- 401 S Anaheim Blvd Unit 7
- 425 S Anaheim Blvd Unit 3
- 719 S Pine St
- 700 N Westwood Place
- 615 S Hazelwood St
- 628 S Clementine St
- 278 N Wilshire Ave Unit 156
- 510 S Anaheim Blvd Unit 7
- 110 S Seneca Cir Unit 6
- 112 S Seneca Cir
- 108 S Seneca Cir Unit 5
- 106 S Seneca Cir
- 104 S Seneca Cir Unit 3
- 702 W Lincoln Ave
- 102 S Seneca Cir Unit 2
- 100 S Seneca Cir Unit 1
- 116 S Seneca Cir
- 284 S Seneca Cir
- 706 W Lincoln Ave
- 118 S Seneca Cir Unit 9
- 286 S Seneca Cir Unit 51
- 286 S Seneca Cir
- 282 S Seneca Cir Unit 49
- 282 S Seneca Cir
- 120 S Seneca Cir Unit 10
- 280 S Seneca Cir Unit 48
- 288 S Seneca Cir Unit 52
- 278 S Seneca Cir Unit 47