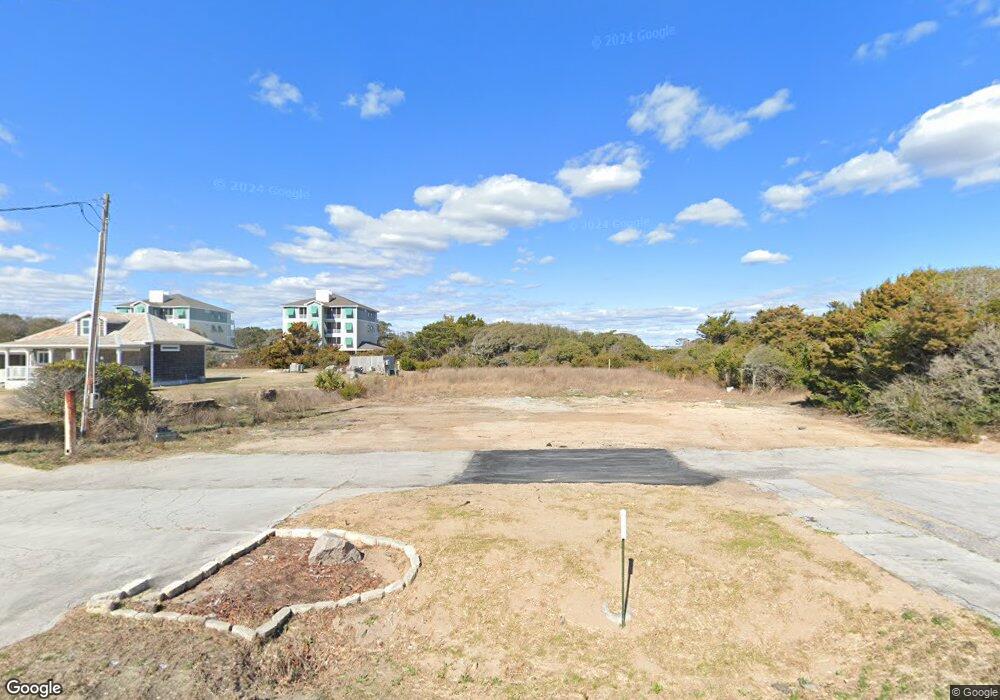
112 Salter Path Pine Knoll Shores, NC 28512
Estimated Value: $381,042 - $479,000
Studio
1
Bath
2,270
Sq Ft
$189/Sq Ft
Est. Value
About This Home
This home is located at 112 Salter Path, Pine Knoll Shores, NC 28512 and is currently estimated at $430,021, approximately $189 per square foot. 112 Salter Path is a home located in Carteret County with nearby schools including Morehead City Primary School, Morehead Elementary School at Camp Glenn, and Morehead City Middle School.
Ownership History
Date
Name
Owned For
Owner Type
Purchase Details
Closed on
Nov 7, 2024
Sold by
Pks Market Property Llc
Bought by
Seaside Development Partners Llc
Current Estimated Value
Purchase Details
Closed on
Jan 20, 2022
Sold by
Taylor William B and Taylor April
Bought by
Pks Market Property Llc
Purchase Details
Closed on
Feb 16, 2018
Sold by
Dm Trust Llc
Bought by
Taylor William B
Home Financials for this Owner
Home Financials are based on the most recent Mortgage that was taken out on this home.
Original Mortgage
$160,000
Interest Rate
3.95%
Mortgage Type
New Conventional
Purchase Details
Closed on
Oct 16, 2008
Sold by
White John M and White Janel G
Bought by
Dm Trust Llc
Purchase Details
Closed on
Sep 29, 2006
Sold by
Dm Trust Llc
Bought by
White John M and White Janel G
Home Financials for this Owner
Home Financials are based on the most recent Mortgage that was taken out on this home.
Original Mortgage
$490,000
Interest Rate
6.48%
Mortgage Type
Seller Take Back
Purchase Details
Closed on
Jan 9, 2001
Purchase Details
Closed on
Oct 27, 1993
Create a Home Valuation Report for This Property
The Home Valuation Report is an in-depth analysis detailing your home's value as well as a comparison with similar homes in the area
Home Values in the Area
Average Home Value in this Area
Purchase History
| Date | Buyer | Sale Price | Title Company |
|---|---|---|---|
| Seaside Development Partners Llc | $375,000 | None Listed On Document | |
| Seaside Development Partners Llc | $375,000 | None Listed On Document | |
| Pks Market Property Llc | $325,000 | Chicago Title | |
| Taylor William B | $165,000 | None Available | |
| Dm Trust Llc | $490,000 | None Available | |
| White John M | $490,000 | None Available | |
| -- | $200,000 | -- | |
| -- | $160,000 | -- |
Source: Public Records
Mortgage History
| Date | Status | Borrower | Loan Amount |
|---|---|---|---|
| Previous Owner | Taylor William B | $160,000 | |
| Previous Owner | White John M | $490,000 |
Source: Public Records
Tax History
| Year | Tax Paid | Tax Assessment Tax Assessment Total Assessment is a certain percentage of the fair market value that is determined by local assessors to be the total taxable value of land and additions on the property. | Land | Improvement |
|---|---|---|---|---|
| 2025 | $833 | $370,172 | $370,172 | $0 |
| 2024 | $567 | $166,800 | $166,800 | $0 |
| 2023 | $582 | $166,800 | $166,800 | $0 |
| 2022 | $565 | $166,800 | $166,800 | $0 |
| 2021 | $565 | $166,800 | $166,800 | $0 |
| 2020 | $565 | $166,800 | $166,800 | $0 |
| 2019 | $872 | $276,302 | $200,160 | $76,142 |
| 2017 | $872 | $276,302 | $200,160 | $76,142 |
| 2016 | $872 | $276,302 | $200,160 | $76,142 |
| 2015 | $844 | $276,302 | $200,160 | $76,142 |
| 2014 | $1,040 | $341,710 | $271,920 | $69,790 |
Source: Public Records
Map
Nearby Homes
- 116 Salter Path Rd Unit 102
- 112 Oakleaf Dr Unit 1003a
- 112 Oakleaf Dr Unit 1002-A
- 2800 W Fort MacOn Rd Unit 56
- 2800 W Fort MacOn Rd Unit 46
- 7 Bermuda Greens
- 121 Oakleaf Dr
- 130 Salter Path Rd Unit B-9
- 130 Salter Path Rd Unit 83
- 131 Oakleaf Dr
- 107 Beachwood Dr Unit 2B
- 2509 W Fort MacOn Rd Unit 103 B
- 2509 W Fort MacOn Rd Unit 102B
- 2503 W Fort MacOn Rd Unit 108a
- 112 Lee Dr Unit A
- 2503 Ft MacOn Rd W Unit 207-A
- 300 Forest Knoll Dr
- 105 Laurel Ct
- 2511 W Fort MacOn Rd Unit 111b
- 2511 W Fort MacOn Rd Unit 208b
- 112 Salter Path Rd
- 116 Salter Path Rd Unit 202
- 116 Salter Path Rd Unit 201
- 116 Salter Path Rd Unit 101
- 116 Salter Path Rd
- 112 Oak Leaf Dr Unit 1203B
- 112 Oakleaf Dr Unit 1201B
- 112 Oakleaf Dr Unit 901a
- 112 Oakleaf Dr Unit 902a
- 112 Oakleaf Dr Unit 1202B
- 112 Oakleaf Dr Unit 1101-B Shutters on t
- 112 Oakleaf Dr
- 112 Oakleaf Dr Unit 1102B Shutters on So
- 112 Oakleaf Dr Unit 1001a
- 112 Oakleaf Dr Unit 1101b
- 0 Salter Path Rd Unit 4900 points
- 117 Salter Path Rd Unit 702b
- 117 Salter Path Rd Unit 502C
- 117 Salter Path Rd Unit 501C-A
- 117 Salter Path Rd Unit 503a
Your Personal Tour Guide
Ask me questions while you tour the home.