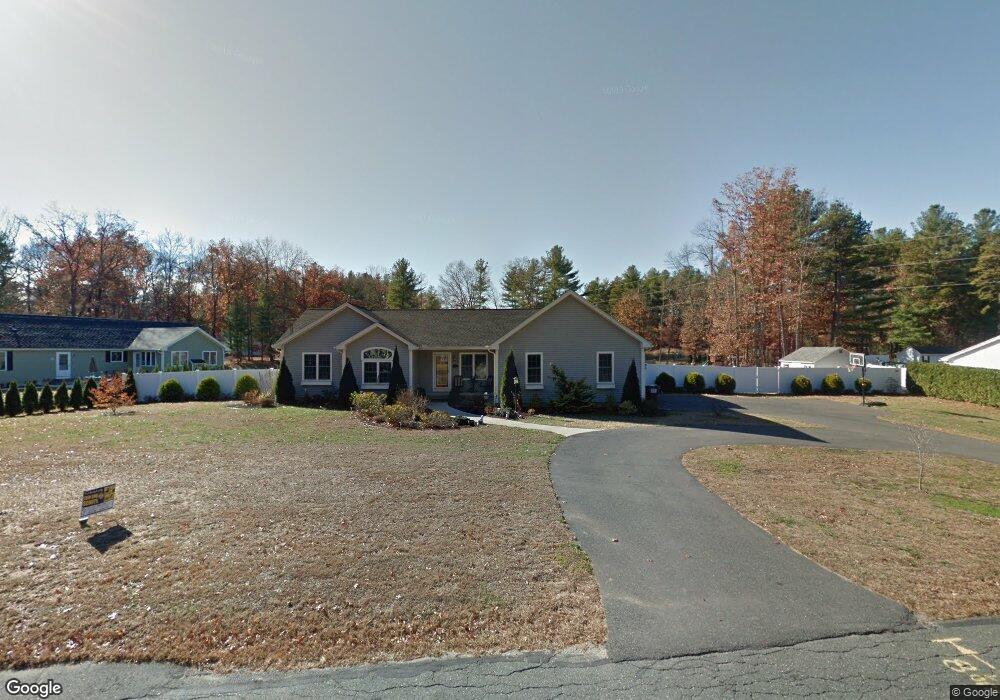
112 Strong St Easthampton, MA 01027
Estimated Value: $598,876 - $621,000
3
Beds
3
Baths
1,974
Sq Ft
$308/Sq Ft
Est. Value
About This Home
This home is located at 112 Strong St, Easthampton, MA 01027 and is currently estimated at $607,469, approximately $307 per square foot. 112 Strong St is a home located in Hampshire County with nearby schools including Easthampton High School, Calvary Baptist Christian School, and Tri-County Schools.
Ownership History
Date
Name
Owned For
Owner Type
Purchase Details
Closed on
Apr 30, 2008
Sold by
David Garstka Bldrs Ll
Bought by
Michalik Christine M and Michalik Robert E
Current Estimated Value
Home Financials for this Owner
Home Financials are based on the most recent Mortgage that was taken out on this home.
Original Mortgage
$180,000
Outstanding Balance
$114,647
Interest Rate
5.99%
Mortgage Type
Purchase Money Mortgage
Estimated Equity
$492,822
Purchase Details
Closed on
Dec 15, 2006
Sold by
Bozek Mary
Bought by
David Garstka Builder
Home Financials for this Owner
Home Financials are based on the most recent Mortgage that was taken out on this home.
Original Mortgage
$126,000
Interest Rate
6.31%
Mortgage Type
Purchase Money Mortgage
Create a Home Valuation Report for This Property
The Home Valuation Report is an in-depth analysis detailing your home's value as well as a comparison with similar homes in the area
Home Values in the Area
Average Home Value in this Area
Purchase History
| Date | Buyer | Sale Price | Title Company |
|---|---|---|---|
| Michalik Christine M | $315,000 | -- | |
| David Garstka Builder | $180,000 | -- |
Source: Public Records
Mortgage History
| Date | Status | Borrower | Loan Amount |
|---|---|---|---|
| Open | Michalik Christine M | $180,000 | |
| Previous Owner | David Garstka Builder | $126,000 |
Source: Public Records
Tax History Compared to Growth
Tax History
| Year | Tax Paid | Tax Assessment Tax Assessment Total Assessment is a certain percentage of the fair market value that is determined by local assessors to be the total taxable value of land and additions on the property. | Land | Improvement |
|---|---|---|---|---|
| 2025 | $6,749 | $493,700 | $115,900 | $377,800 |
| 2024 | $6,606 | $487,200 | $112,400 | $374,800 |
| 2023 | $4,943 | $337,400 | $89,200 | $248,200 |
| 2022 | $5,577 | $337,400 | $89,200 | $248,200 |
| 2021 | $6,132 | $349,600 | $89,200 | $260,400 |
| 2020 | $5,992 | $337,400 | $89,200 | $248,200 |
| 2019 | $5,069 | $327,900 | $89,200 | $238,700 |
| 2018 | $4,882 | $305,100 | $83,900 | $221,200 |
| 2017 | $4,772 | $294,400 | $80,800 | $213,600 |
| 2016 | $4,696 | $301,200 | $80,800 | $220,400 |
| 2015 | $4,563 | $301,200 | $80,800 | $220,400 |
Source: Public Records
Map
Nearby Homes
- 4 Laurel Dr
- 36 Line St
- 1 Plain St
- 95 Gunn Rd
- 7 Western View Rd
- 245 Park St
- 2 W Park Dr
- 6 S St & Abutting Lots
- 48 Gunn Rd
- 36 County Rd
- 41 South St Unit 11
- 38 College Hwy
- 179 Central Park Dr
- 19 Mount Tom Ave Unit 19
- 385 Main St
- 1205 Northampton St
- 37 Laura Ln
- 19 Nicols Way Unit 19
- M143 &152 Glendale St
- 22 Liberty St